Слайд 2
Our Goals
To review the history of health
disparities.
To address why the United States spends more money
than any other country in the world for healthcare both in total dollars and by percentage of gross national product with the latest technology to treat diseases with the best-trained physicians; yet, we have a relatively high infant mortality rate and rank low in life expectancy in comparison to other industrialized nations.
To additionally address issues with class, race, and gender inequalities of health and healthcare delivery.
To distinguish demographics for R/E minorities.
Слайд 3
History of Health Disparities
During slavery medical care
was brutal and ineffective for most people.
Slaves suffered innumerable
kinds of maltreatment and misdiagnosis.
One account is that of John Brown.
Brown wrote in his memoir (after his escape) of the treatment he suffered at the hands of doctors.
Page 252
Слайд 4
History of Health Disparities
Live and Dead Bodies
In
1989 (GA) construction workers found nearly 10,000 human bones
and skulls beneath what was once the Medical College of GA.
In the 19c, Drs. had ordered porter to remove the bodies for medical dissection.
75% were African American
Tuskegee Syphilis Experiment
1932
PHS and the TI in AL recruited 400 poor black men for a study on long-term syphilis.
Did not diagnosis them w/syphilis but rather “bad blood.”
Drs. wanted to know if left untreated its effects on the body.
Слайд 5
History of Health Disparities
Involuntary Sterilization
In the
early to mid-20c, hundreds of black girls and women
were subjected to involuntary sterilization.
Done without permission
Became known as the ‘Mississippi Appendectomy’
P. 255
Experimental Radiation
1945
Ebb Cade
No consent given
Eventually escaped the hospital and ill treatment
Later died of heart disease
Слайд 6
History of Health Disparities
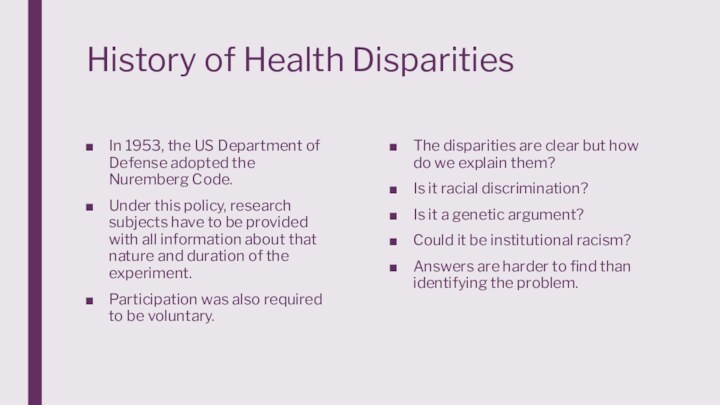
In 1953, the US
Department of Defense adopted the Nuremberg Code.
Under this
policy, research subjects have to be provided with all information about that nature and duration of the experiment.
Participation was also required to be voluntary.
The disparities are clear but how do we explain them?
Is it racial discrimination?
Is it a genetic argument?
Could it be institutional racism?
Answers are harder to find than identifying the problem.
Слайд 7
Rising Healthcare Costs
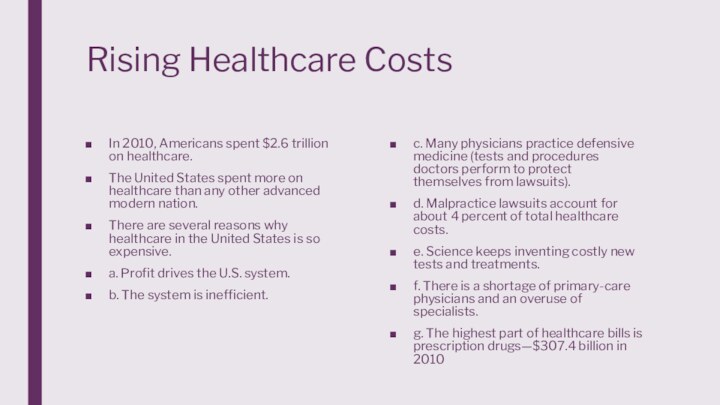
In 2010, Americans spent $2.6
trillion on healthcare.
The United States spent more on healthcare
than any other advanced modern nation.
There are several reasons why healthcare in the United States is so expensive.
a. Profit drives the U.S. system.
b. The system is inefficient.
c. Many physicians practice defensive medicine (tests and procedures doctors perform to protect themselves from lawsuits).
d. Malpractice lawsuits account for about 4 percent of total healthcare costs.
e. Science keeps inventing costly new tests and treatments.
f. There is a shortage of primary-care physicians and an overuse of specialists.
g. The highest part of healthcare bills is prescription drugs—$307.4 billion in 2010
Слайд 8
Does the High Cost of Healthcare Translate Into
Good Health Consequences?
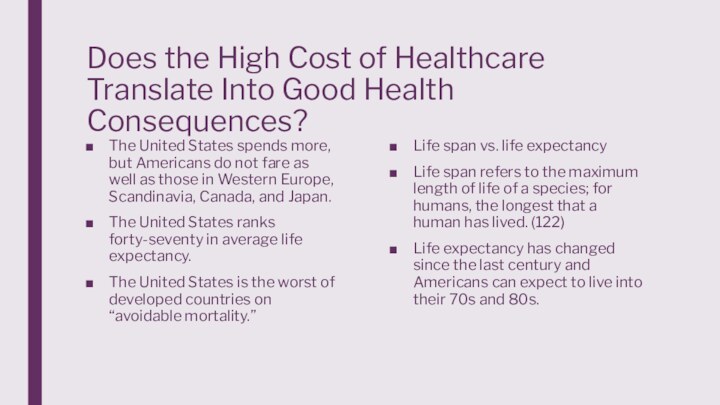
The United States spends more, but Americans
do not fare as well as those in Western Europe, Scandinavia, Canada, and Japan.
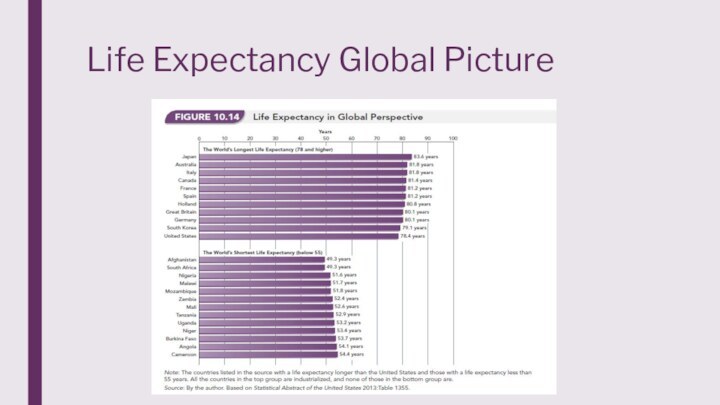
The United States ranks forty-seventy in average life expectancy.
The United States is the worst of developed countries on “avoidable mortality.”
Life span vs. life expectancy
Life span refers to the maximum length of life of a species; for humans, the longest that a human has lived. (122)
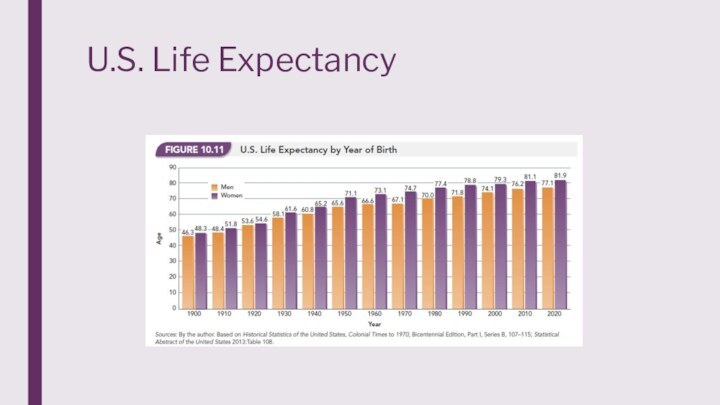
Life expectancy has changed since the last century and Americans can expect to live into their 70s and 80s.
Слайд 12
Updating the Uninsured
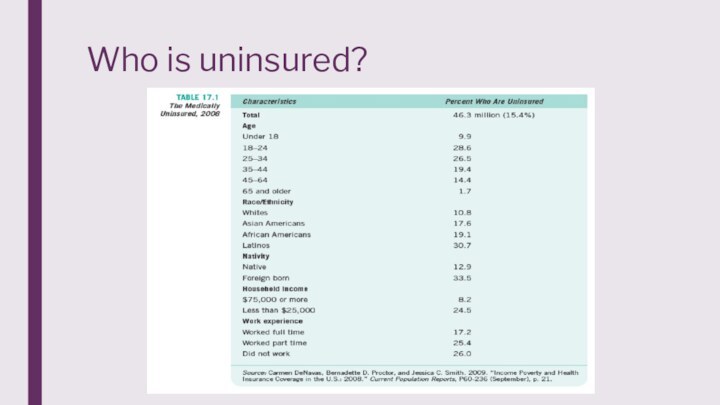
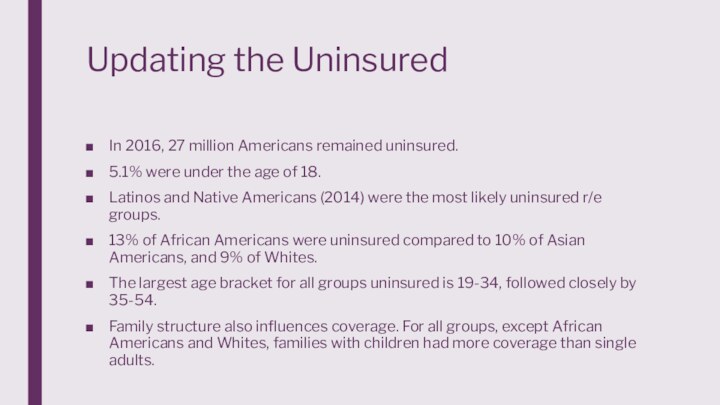
In 2016, 27 million Americans
remained uninsured.
5.1% were under the age of 18.
Latinos
and Native Americans (2014) were the most likely uninsured r/e groups.
13% of African Americans were uninsured compared to 10% of Asian Americans, and 9% of Whites.
The largest age bracket for all groups uninsured is 19-34, followed closely by 35-54.
Family structure also influences coverage. For all groups, except African Americans and Whites, families with children had more coverage than single adults.
Слайд 13
Unequal Access
A key question in examining the
structure of healthcare delivery is who benefits and who
suffers from the way the system is organized?
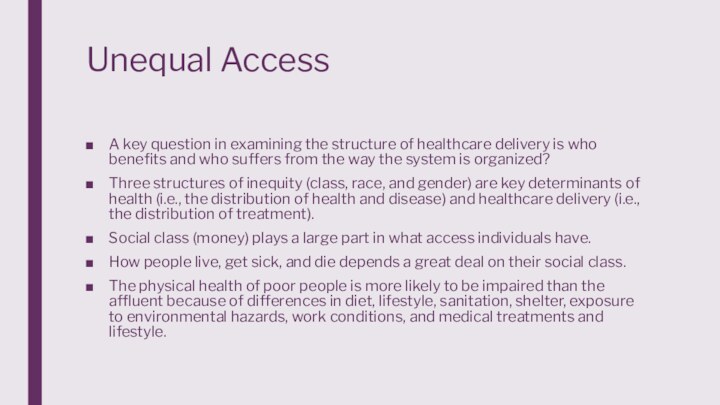
Three structures of inequity (class, race, and gender) are key determinants of health (i.e., the distribution of health and disease) and healthcare delivery (i.e., the distribution of treatment).
Social class (money) plays a large part in what access individuals have.
How people live, get sick, and die depends a great deal on their social class.
The physical health of poor people is more likely to be impaired than the affluent because of differences in diet, lifestyle, sanitation, shelter, exposure to environmental hazards, work conditions, and medical treatments and lifestyle.
Слайд 14
Unequal Access
An advantage of the affluent is
access to health-promoting and health-protecting resources, and to medical
services typically paid for with health insurance.
The uninsured cannot afford the costs for physicians, dentists, and hospitals, so they often do without.
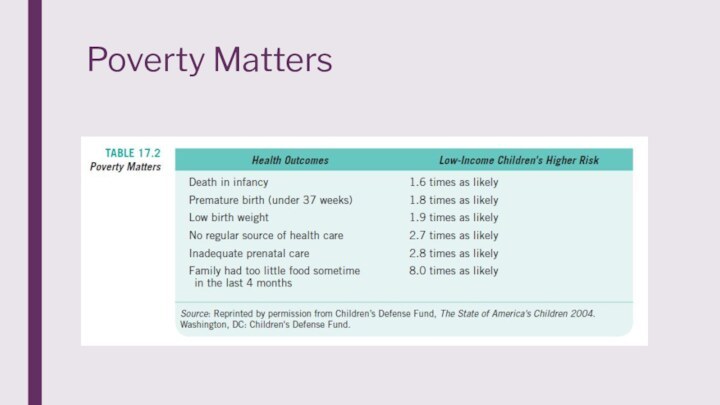
Poor pregnant women often do not receive prenatal or postnatal health care, resulting in a high maternal death rate and a relatively high infant mortality rate.
Ironically, when the uninsured go to a doctor, they pay more for services than insured patients.
Слайд 15
Unequal Access
Location matters too!
States with the
lowest premiums are Arizona, New Mexico, Kentucky, DoC, and
Maryland.
States with the highest premiums are NC, WY, NY, AK, and VT.
States with the most doctors per capita are DoC, MA, RI, NY, and CT.
States with the least doctors per capita are Utah, MS, Nevada, WY, and Idaho.
Слайд 16
Unequal Access
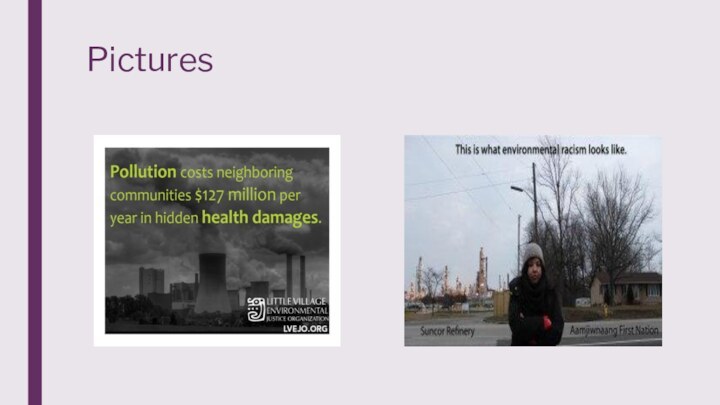
Environmental racism can’t be left out
either.
Page 266
Holt Family p. 268
Subsequently, location and disease
are related.
States with lowest rates of cancer are NM, Nevada, and AZ. (Highest are NY, PA, and LA.)
States with the lowest rates of heart disease are HI, MN, and CO. (Highest are LA, AL, and MS.)
Слайд 21
Unequal Access: The Poor
When the poor do
go to physicians they are more likely to receive
inferior services because of several factors:
The poor are often served by understaffed clinics and hospitals.
There are disproportionately fewer physicians in poor urban and rural areas.
The belief that the poor are accountable for their health deficiencies blames the victim and ignores the realities of social class.
Culture of Poverty (theory)
Слайд 22
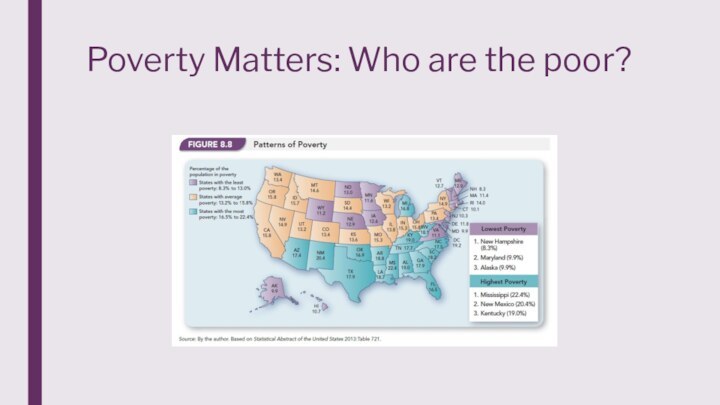
Poverty Matters: Who are the poor?
Слайд 23
Poverty Matters: Who are the poor?
Race-ethnicity is a
major factor; Of these groups these are the percentages
in poverty:
11% Whites (of all U.S. poor 44%)
12% Asian Americans (4%)
23% Latinos (25%)
27% African Americans (27%)
29% Native Americans (2%)
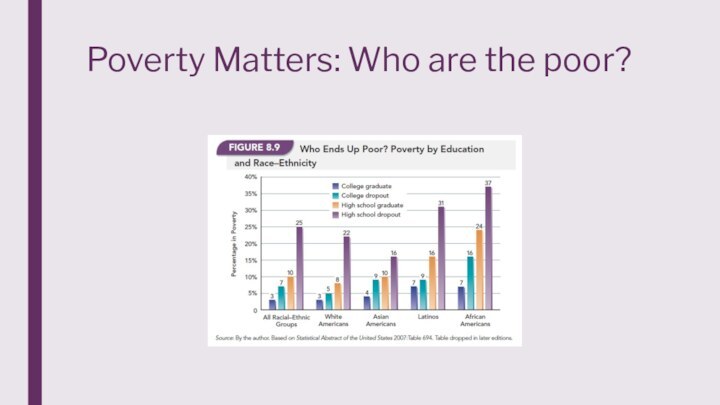
Education: Only 3% of people who finish college end up in poverty.
Gender: Sex of the head of household --- the feminization of poverty. Single-parent families headed by women have a higher propensity of being poor.
Слайд 24
Poverty Matters: Who are the poor?
Слайд 25
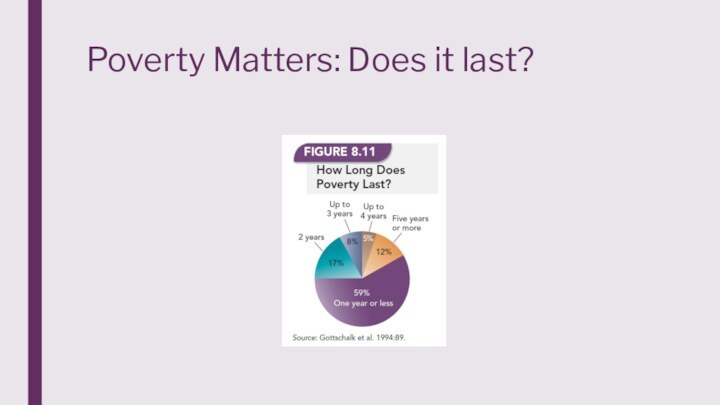
Poverty Matters: Does it last?
Research finds that most
poverty is short-lived.
The number of those who live in
poverty remains consistent, meaning that as many people move into poverty as move out of it.
About ¼ of the U.S. population is or has been poor for at least a year.
Sociologists look to such factors as inequalities in education, access to learning job skills, racial, ethnic, age, and gender discrimination, and large scale economic change to explain the patterns of poverty in society.
Another explanation focuses on how characteristics of individuals are assumed to contribute to their poverty. Sociologists reject explanations that focus on qualities of laziness or lack of intelligence to explain poverty.
Слайд 28
Racial/Ethnic Discrepancies
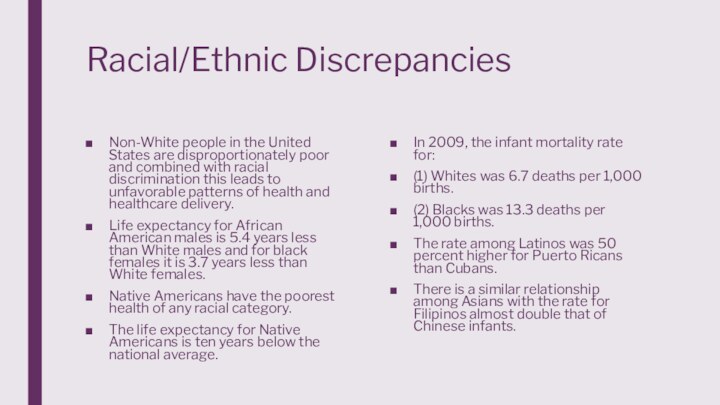
Non-White people in the United States
are disproportionately poor and combined with racial discrimination this
leads to unfavorable patterns of health and healthcare delivery.
Life expectancy for African American males is 5.4 years less than White males and for black females it is 3.7 years less than White females.
Native Americans have the poorest health of any racial category.
The life expectancy for Native Americans is ten years below the national average.
In 2009, the infant mortality rate for:
(1) Whites was 6.7 deaths per 1,000 births.
(2) Blacks was 13.3 deaths per 1,000 births.
The rate among Latinos was 50 percent higher for Puerto Ricans than Cubans.
There is a similar relationship among Asians with the rate for Filipinos almost double that of Chinese infants.
Слайд 29
Racial/Ethnic Discrepancies
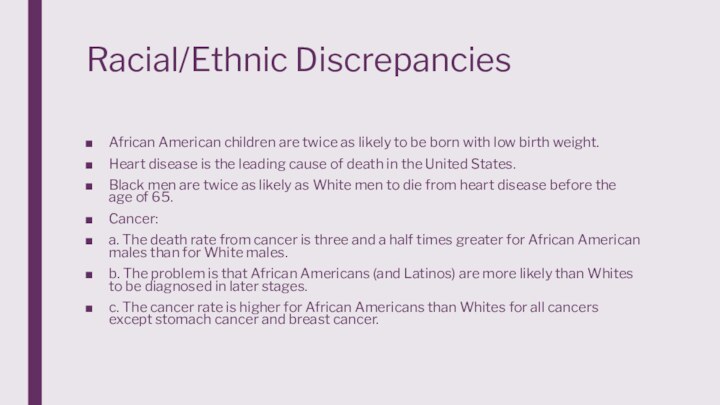
African American children are twice as
likely to be born with low birth weight.
Heart disease
is the leading cause of death in the United States.
Black men are twice as likely as White men to die from heart disease before the age of 65.
Cancer:
a. The death rate from cancer is three and a half times greater for African American males than for White males.
b. The problem is that African Americans (and Latinos) are more likely than Whites to be diagnosed in later stages.
c. The cancer rate is higher for African Americans than Whites for all cancers except stomach cancer and breast cancer.
Слайд 30
Racial/Ethnic Discrepancies
d. Black women have lower breast
cancer rates in part because of the tendency to
have children at younger ages.
e. Whites have a higher survival rate of cancer once detected.
f. Latinos have the lowest incidence of breast cancer but their chances of survival are not as good as Whites.
g. Asian American women are much less likely than White or Black women to develop breast cancer and have the best five-year survival rates.
Слайд 31
Racial/Ethnic Discrepancies
African Americans are twice as likely
as Whites to have Alzheimer’s or other forms of
dementia.
Over 9 million Americans have visual impairment, usually caused by glaucoma, diabetes, and retinal diseases.
Black adults are nearly twice as likely as Whites to be legally blind or visually impaired.
Latinos are more likely than Whites to be blind primarily because of complications from diabetes.
Diseases found among the poor (e.g., influenza, pneumonia, and tuberculosis) are disproportionately found among non-Whites because racial minorities are disproportionately poor.
Слайд 32
Racial/Ethnic Discrepancies
The poor in general, and racial
minorities in particular, are more likely than Whites to
rely on emergency room departments than on a family physician. This reliance has four negative outcomes:
(1) The poor do not meet regularly with a physician who is familiar with their health history.
(2) The number of hospitals in poor sections of cities is declining.
(3) Federal cutbacks resulted in decreased medical attention for the poor.
(4) Even when health services are accessible, minorities may face racial discrimination.
Слайд 33
Racial/Ethnic Discrepancies – more specifically
Asian Americans:
81-87 life
expectancy
Only 14.6% without health insurance
Low rates of obesity, heart
disease, stroke, car accidents, suicides, homicides, drug abuse, and deaths due to AIDS.
Education, Income, Family Structure
African Americans:
Slaves often suffered immensely but could not refuse treatment
Experiments were often performed without awareness
Women involuntarily sterilized
Currently, more likely at every age to die than any other racial group.
Twice as likely as Whites to die of diabetes, five times as likely from homicide, and eight times as likely from AIDS.
African Americans have a 32% higher age-adjusted death rate than Whites for all causes.
Pages 251-256
Слайд 34
Racial/Ethnic Discrepancies – more specifically
Latinos:
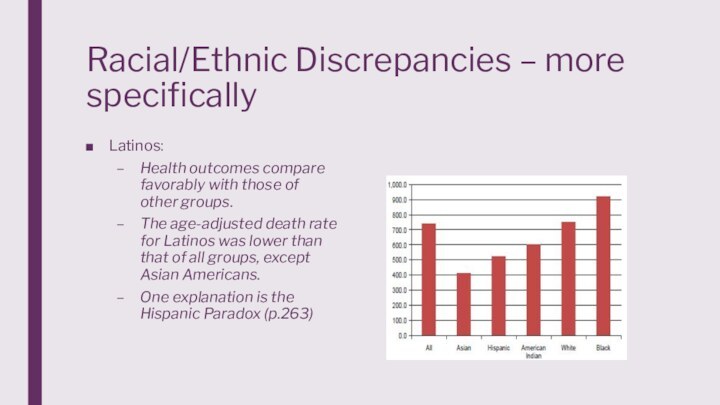
Health outcomes compare
favorably with those of other groups.
The age-adjusted death rate
for Latinos was lower than that of all groups, except Asian Americans.
One explanation is the Hispanic Paradox (p.263)
Слайд 35
Racial/Ethnic Discrepancies – more specifically
Native Americans:
Higher
death rates than whites
Suicide is a leading cause of
death
Binge drinking is an issue – AIAN report more binge drinking episodes per month and higher alcohol consumption per episode than any other racial-ethnic group. 24.9%
According to the WH, “From 2003-2011, American Indian/Alaska Native were more likely to need alcohol or illicit drug use treatment than persons of other groups by age, gender, poverty level, and rural/urban residence.”
Слайд 36
Racial/Ethnic Discrepancies – more specifically
The rate of
past month binge alcohol use was rising among AI/AN
adults than the national average (30.6% vs. 24.5%)
The rate of past month illicit drug use was rising among AI/AN adults than the national average (11.2% vs. 7.9%)
Cited by SAMHSA
Among AI/AN people, cancer is one of the leading causes of death followed by heart disease.
Death rates from lung cancer have shown little improvement in AI/AN populations. AI/AN people have the highest prevalence of tobacco use of any population in the United States.
Deaths from injuries were higher among AI/AN people compared to non-Hispanic whites.
CDC
Слайд 37
Racial/Ethnic Discrepancies – more specifically
Suicide rates were
nearly 50 percent higher for AI/AN people compared to
non-Hispanic whites, and more frequent among AI/AN males and persons younger than age 25.
Death rates from motor vehicle crashes, poisoning, and falls were two times higher among AI/AN people than for non-Hispanic whites.
Death rates were higher among AI/AN infants compared to non-Hispanic white infants. Sudden infant death syndrome and unintentional injuries were more common. AI/AN infants were four times more likely to die from pneumonia and influenza.
By region, the greatest death rates were in the Northern Plains and Southern Plains. The lowest death rates were in the East and the Southwest. (CDC)
Слайд 38
Conclusion
One of the core values of the
U.S. is that everyone should have an equal opportunity
to flourish.
How does this ideology coexist with the reality of health care access?
By discussing the issues with who has insurance, sexism in healthcare, R/E discrepancies etc. we can be one step closer in answering this question.
What does your perfect health care system look like?
