Слайд 2
Economic Growth
Economic growth is a long-term expansion of
the productive potential of the economy.
Growth is not the
same as development! Growth can support development but the two are distinct.
M. Todaro defines economic development as an increase in living standards, improvement in self-esteem needs and freedom from oppression as well as a greater choice.
Economic development is Concerned with structural changes in the economy, but economic growth is concerned only with increase in the economy’s output.
Economic growth is a necessary but not sufficient condition of economic development.
Economic growth brings quantitative changes in the economy; where as economic development deals with quantitative and qualitative changes in the economy.
Слайд 3
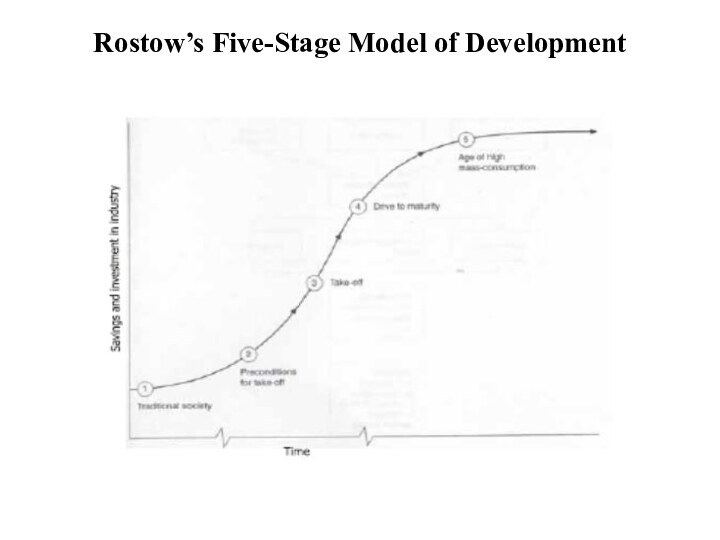
Rostow’s Five-Stage Model of Development
Rostow's Stages of Growth
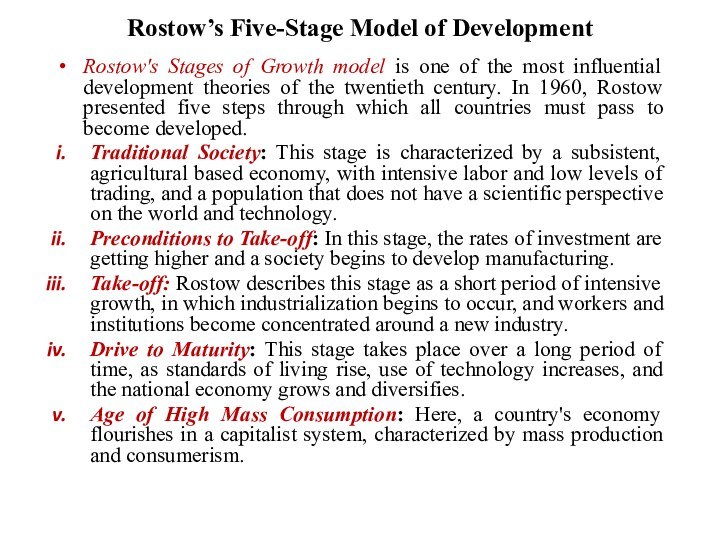
model is one of the most influential development theories
of the twentieth century. In 1960, Rostow presented five steps through which all countries must pass to become developed.
Traditional Society: This stage is characterized by a subsistent, agricultural based economy, with intensive labor and low levels of trading, and a population that does not have a scientific perspective on the world and technology.
Preconditions to Take-off: In this stage, the rates of investment are getting higher and a society begins to develop manufacturing.
Take-off: Rostow describes this stage as a short period of intensive growth, in which industrialization begins to occur, and workers and institutions become concentrated around a new industry.
Drive to Maturity: This stage takes place over a long period of time, as standards of living rise, use of technology increases, and the national economy grows and diversifies.
Age of High Mass Consumption: Here, a country's economy flourishes in a capitalist system, characterized by mass production and consumerism.
Слайд 4
Rostow’s Five-Stage Model of Development
Слайд 5
Modernization Theory
Linear stages of development
Слайд 6
Economic Growth
Growth rate
How rapidly real GDP per person
grew in the typical year.
Growth in GDP per capita
(or per worker) Y/L
Real GDP per person
Living standard
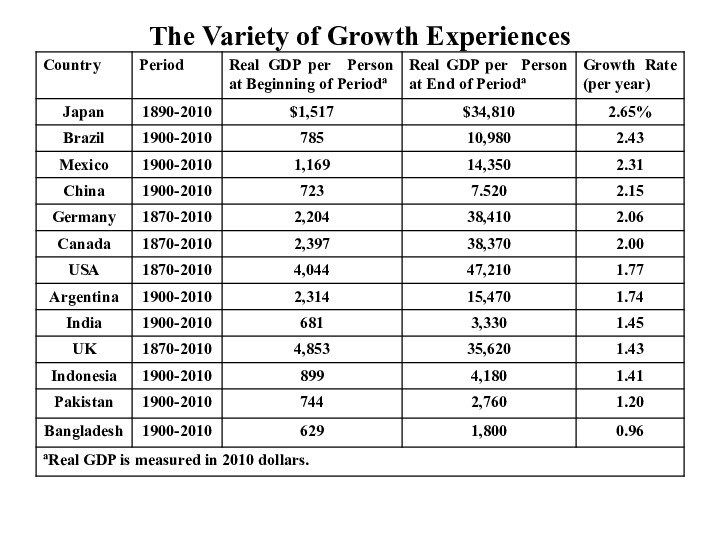
Vary widely from country to country
Because of differences in growth rates
Ranking of countries by income changes substantially over time
Слайд 7
The Variety of Growth Experiences
Слайд 8
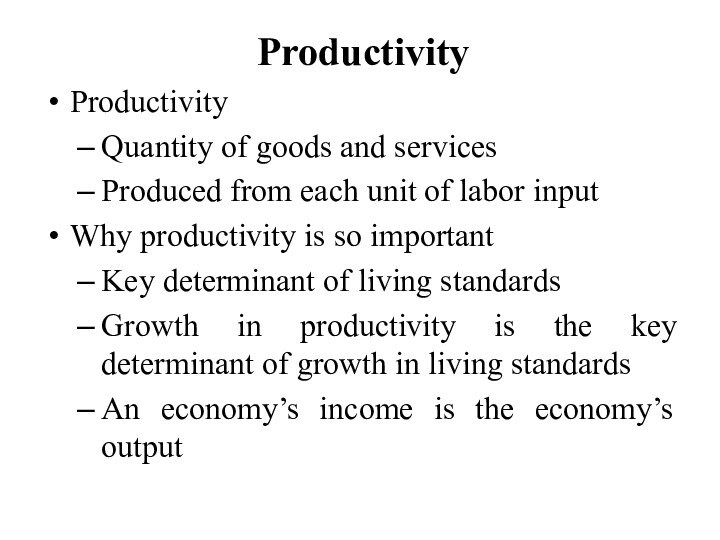
Productivity
Productivity
Quantity of goods and services
Produced from each unit
of labor input
Why productivity is so important
Key determinant of
living standards
Growth in productivity is the key determinant of growth in living standards
An economy’s income is the economy’s output
Слайд 9
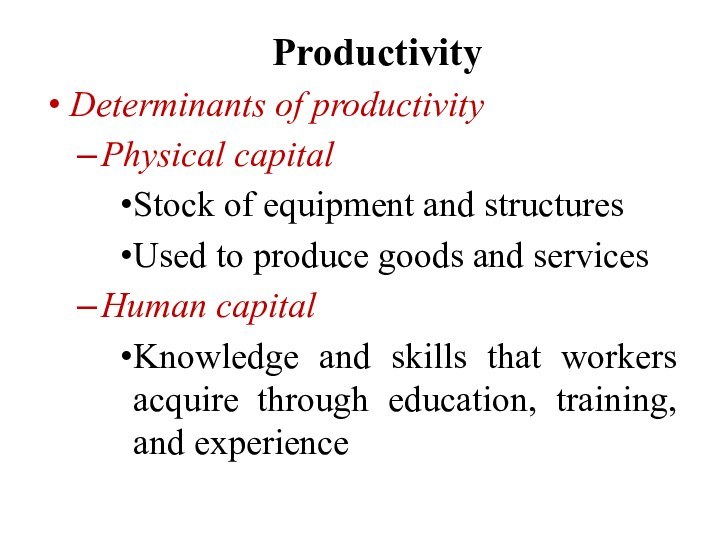
Productivity
Determinants of productivity
Physical capital
Stock of equipment and
structures
Used to produce goods and services
Human capital
Knowledge and skills
that workers acquire through education, training, and experience
Слайд 10
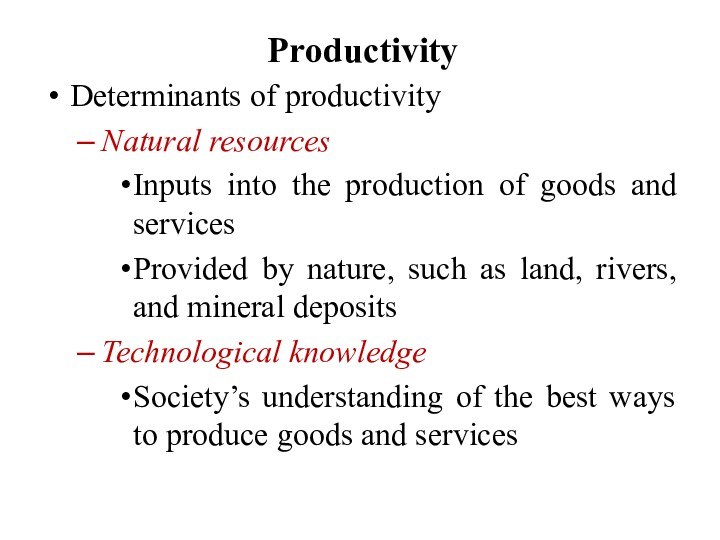
Productivity
Determinants of productivity
Natural resources
Inputs into the production
of goods and services
Provided by nature, such as land,
rivers, and mineral deposits
Technological knowledge
Society’s understanding of the best ways to produce goods and services
Слайд 11
Additionally, other explanations have highlighted the significant role
of non-economic factors.
These include institutional economics which underlines the
substantial role of institutions, policy, legal and political systems (Matthews, 1986; North, 1990; Jutting, 2003)
Economic sociology stressed the importance of socio-cultural factors such as Confucianism in East Asia (Granovetter, 1985; Knack and Keefer, 1997).
Слайд 12
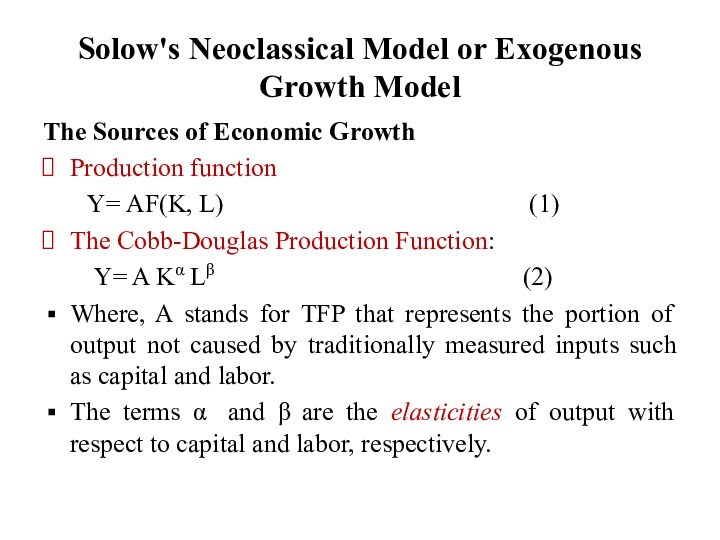
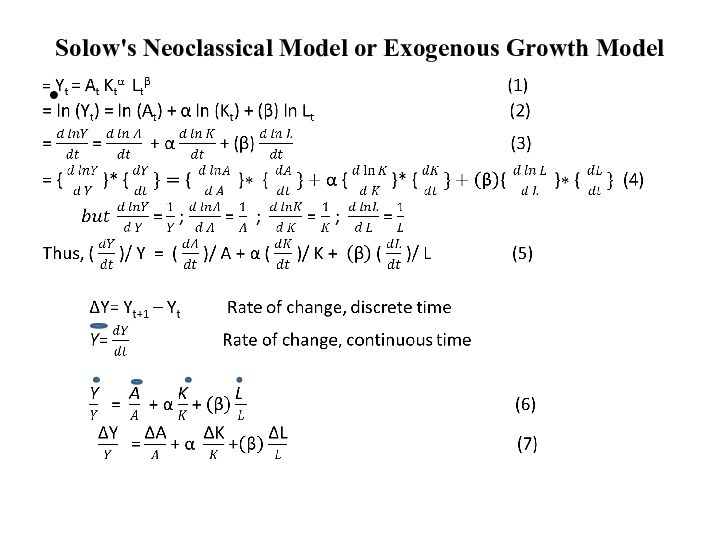
Solow's Neoclassical Model or Exogenous Growth Model
The Sources
of Economic Growth
Production function
Y=
AF(K, L) (1)
The Cobb-Douglas Production Function:
Y= A Kα Lβ (2)
Where, A stands for TFP that represents the portion of output not caused by traditionally measured inputs such as capital and labor.
The terms α and β are the elasticities of output with respect to capital and labor, respectively.
Слайд 13
This can be transformed into a linear model
by taking natural logs of both sides:
ln Y= ln A + α ln K + β ln L (3)
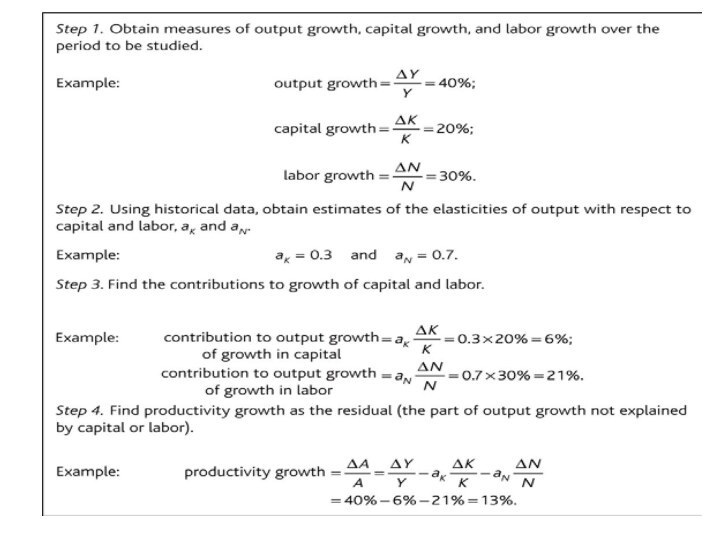
Decompose into growth rate form: the growth accounting equation:
ΔY/Y=ΔA/A + α ΔK/K+ βΔL/L (4)
ΔY/Y= Growth in Output
α (ΔK/K) = Contribution of Capital
(1- α) ΔL/L = Contribution of Labor
ΔA/A = Growth in Total Factor Productivity (TFP)
Growth in TFP represents output growth not accounted for by the growth in inputs.
Слайд 14
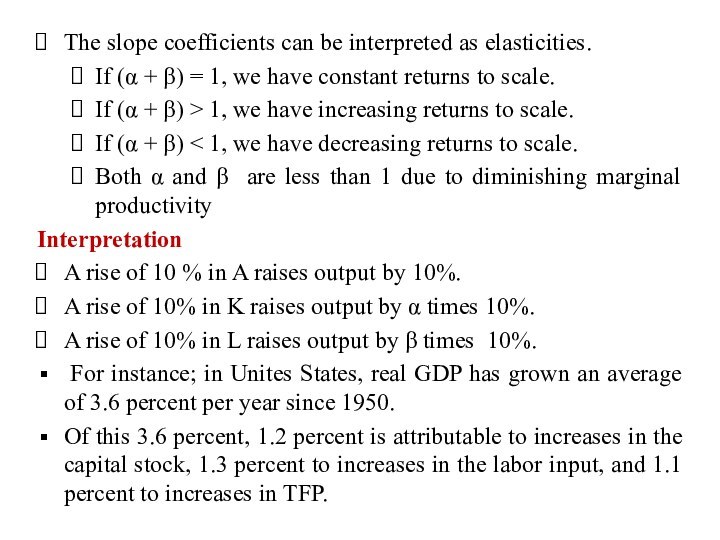
The slope coefficients can be interpreted as elasticities.
If
(α + β) = 1, we have constant returns
to scale.
If (α + β) > 1, we have increasing returns to scale.
If (α + β) < 1, we have decreasing returns to scale.
Both α and β are less than 1 due to diminishing marginal productivity
Interpretation
A rise of 10 % in A raises output by 10%.
A rise of 10% in K raises output by α times 10%.
A rise of 10% in L raises output by β times 10%.
For instance; in Unites States, real GDP has grown an average of 3.6 percent per year since 1950.
Of this 3.6 percent, 1.2 percent is attributable to increases in the capital stock, 1.3 percent to increases in the labor input, and 1.1 percent to increases in TFP.
Слайд 16
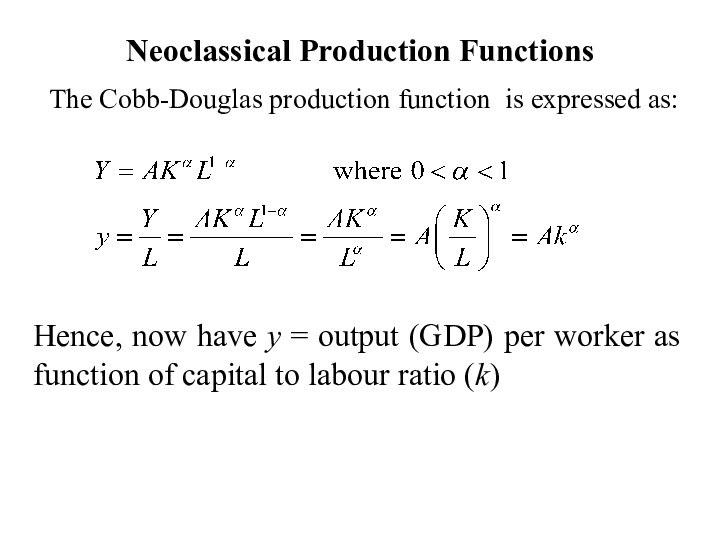
Neoclassical Production Functions
The Cobb-Douglas production function is expressed
as:
Hence, now have y = output (GDP) per worker
as function of capital to labour ratio (k)
Слайд 17
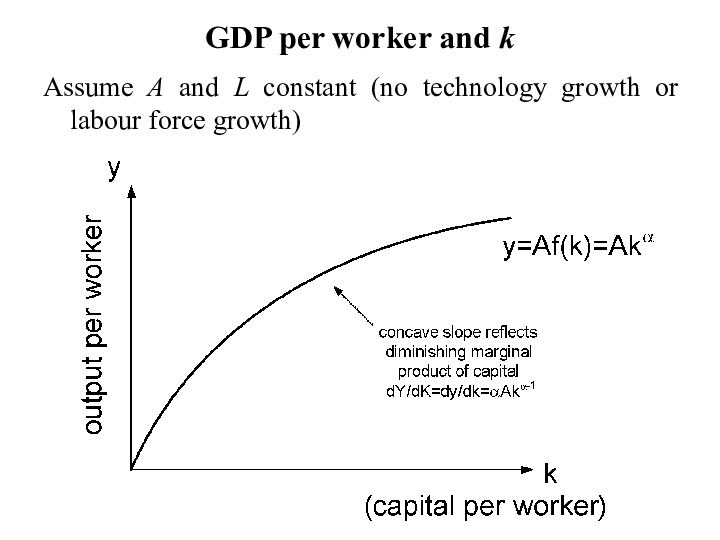
GDP per worker and k
Assume A and L
constant (no technology growth or labour force growth)
Слайд 18
Diminishing Returns
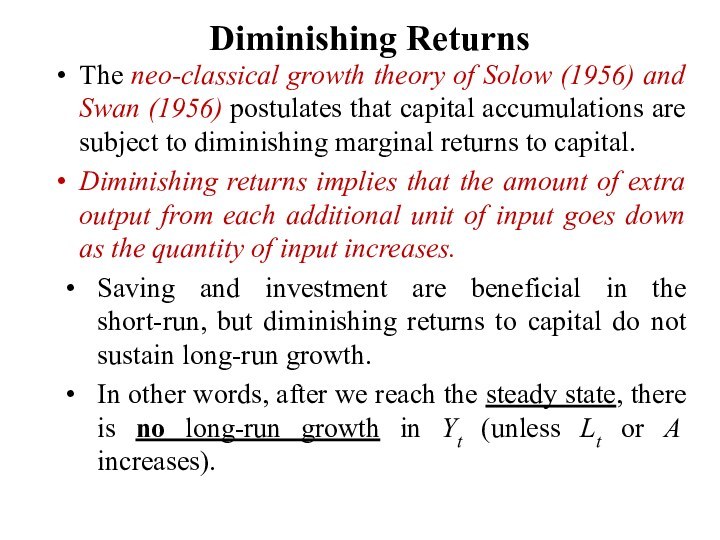
The neo-classical growth theory of Solow (1956)
and Swan (1956) postulates that capital accumulations are subject
to diminishing marginal returns to capital.
Diminishing returns implies that the amount of extra output from each additional unit of input goes down as the quantity of input increases.
Saving and investment are beneficial in the short-run, but diminishing returns to capital do not sustain long-run growth.
In other words, after we reach the steady state, there is no long-run growth in Yt (unless Lt or A increases).
Слайд 19
Illustrating the Production Function
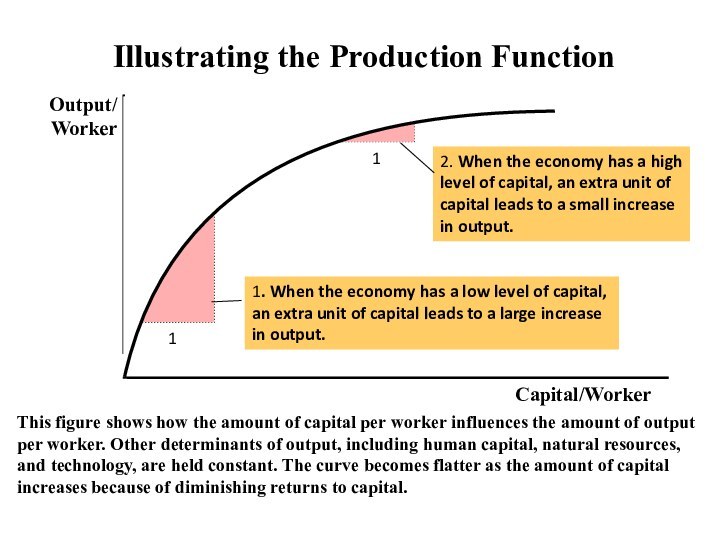
This figure shows how
the amount of capital per worker influences the amount
of output per worker. Other determinants of output, including human capital, natural resources, and technology, are held constant. The curve becomes flatter as the amount of capital increases because of diminishing returns to capital.
Слайд 20
Diminishing Returns
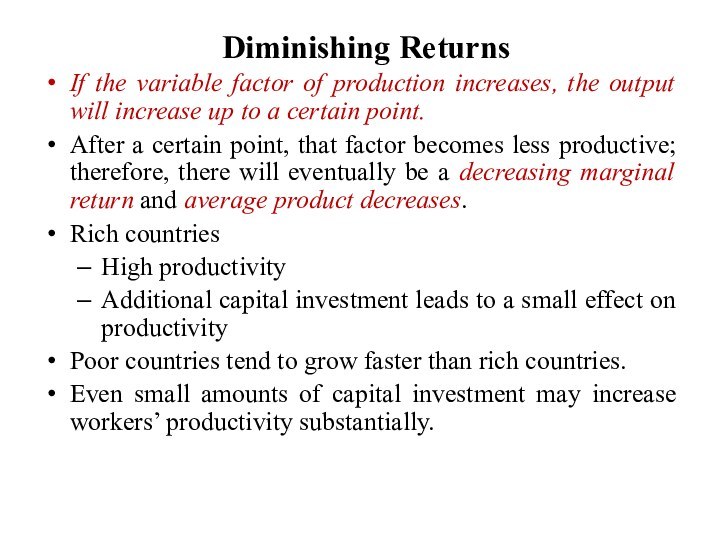
If the variable factor of production increases,
the output will increase up to a certain point.
After
a certain point, that factor becomes less productive; therefore, there will eventually be a decreasing marginal return and average product decreases.
Rich countries
High productivity
Additional capital investment leads to a small effect on productivity
Poor countries tend to grow faster than rich countries.
Even small amounts of capital investment may increase workers’ productivity substantially.
Слайд 21
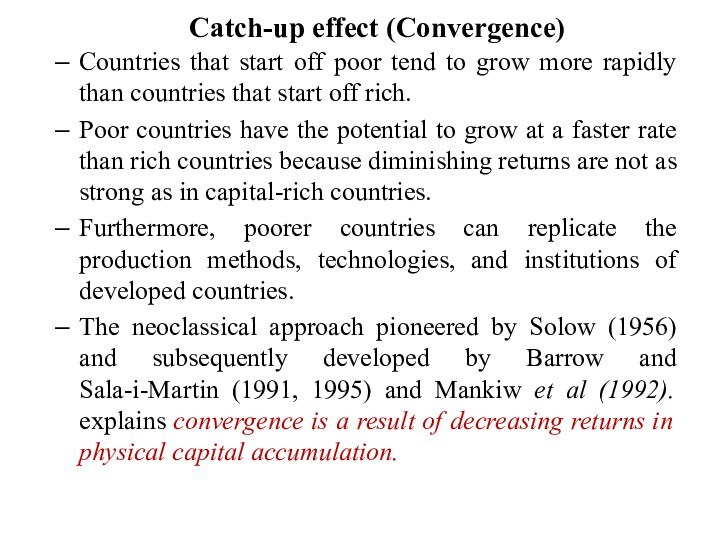
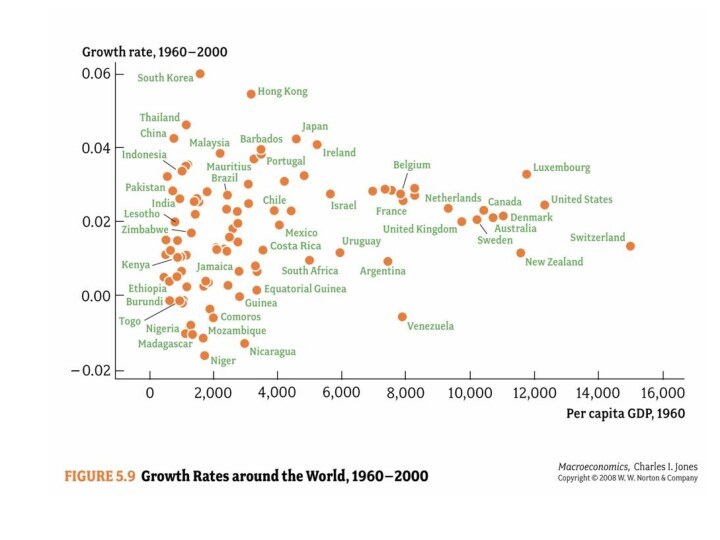
Catch-up effect (Convergence)
Countries that start off poor tend
to grow more rapidly than countries that start off
rich.
Poor countries have the potential to grow at a faster rate than rich countries because diminishing returns are not as strong as in capital-rich countries.
Furthermore, poorer countries can replicate the production methods, technologies, and institutions of developed countries.
The neoclassical approach pioneered by Solow (1956) and subsequently developed by Barrow and Sala-i-Martin (1991, 1995) and Mankiw et al (1992). explains convergence is a result of decreasing returns in physical capital accumulation.
Слайд 22
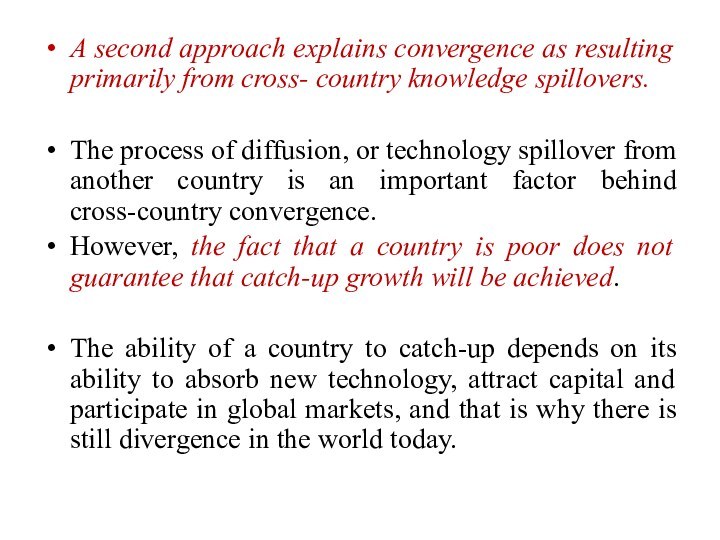
A second approach explains convergence as resulting primarily
from cross- country knowledge spillovers.
The process of diffusion, or
technology spillover from another country is an important factor behind cross-country convergence.
However, the fact that a country is poor does not guarantee that catch-up growth will be achieved.
The ability of a country to catch-up depends on its ability to absorb new technology, attract capital and participate in global markets, and that is why there is still divergence in the world today.
Слайд 23
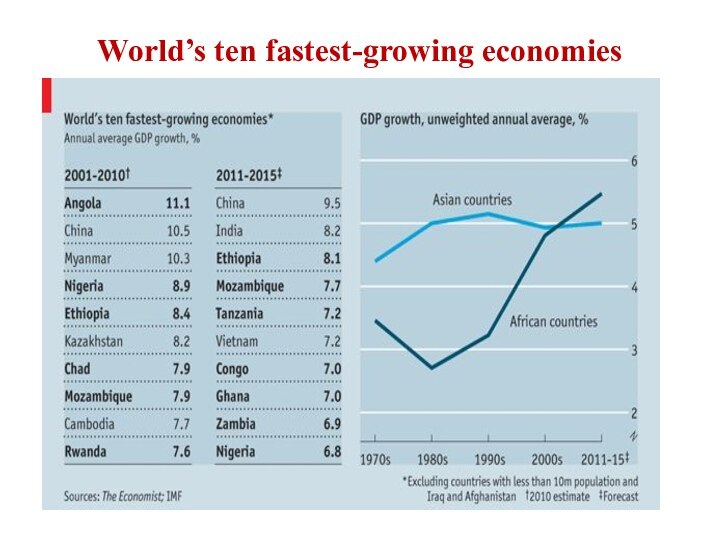
World’s ten fastest-growing economies
Слайд 24
What causes the differences in income over time
and across countries?
The Solow growth model shows how saving,
population growth, and technological progress affect the level of an economy’s output and its growth over time.
Labor grows exogenously through population growth.
Capital is accumulated as a result of savings behavior.
The capital stock is a key determinant of the economy’s output.
But, the capital stock can change over time, and those changes can lead to economic growth.
In particular, two forces influence the capital stock: investment and depreciation.
Слайд 25
Investment refers to the expenditure on new plant
and equipment, and it causes the capital stock to
rise.
Depreciation refers to the wearing out of old capital, and it causes the capital stock to fall.
The saving rate ‘s’ determines the allocation of output between consumption and investment. For any level of k, output is f(k), investment is s f(k), and consumption is
f(k) – sf(k).
On the other hand, investment per worker (i) can be expressed as a function of the capital stock per worker: i= sf(k)
This equation relates the existing stock of capital ‘k’ to the accumulation of new capital ‘i’.
The capital stock next year equals the sum of the capital started with this year plus the amount of investment undertaken this year minus depreciation.
Слайд 26
Depreciation is the amount of capital that wears
out each period ~ 10 percent/year.
kt+1 =kt +It – δ kt
Change in capital stock= investment-Depreciation
Δk = I- δk
Where Δk is the change in the capital stock between one year and the next.
Because investment I equals sf (k), we can write this as:
Δk = sf(k)- δk
The higher the capital stock, the greater the amounts of output and investment.
Yet the higher the capital stock, the greater also the amount of depreciation.
Слайд 27
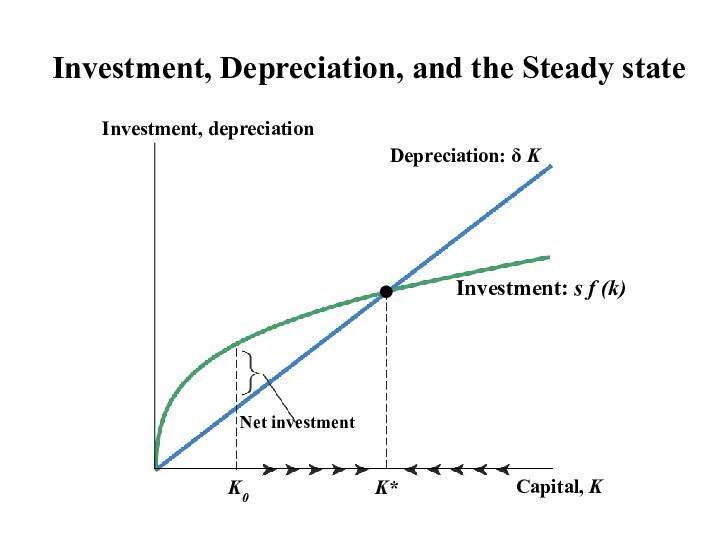
Depreciation: δ K
Investment: s f (k)
Investment, Depreciation, and
the Steady state
Слайд 28
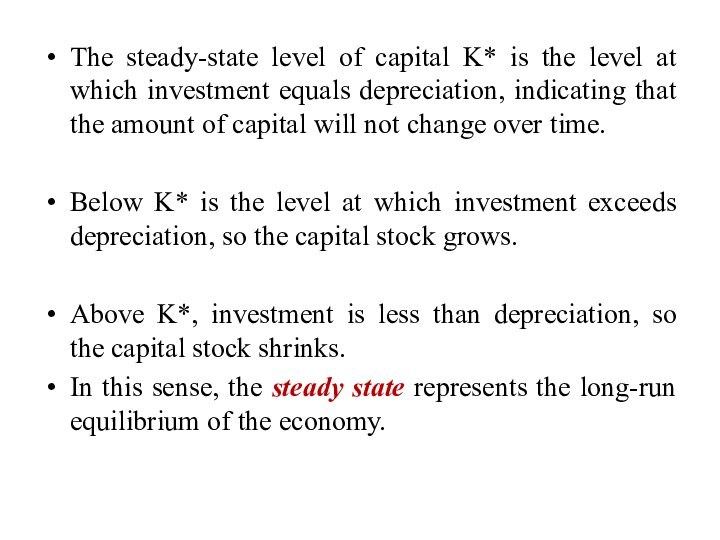
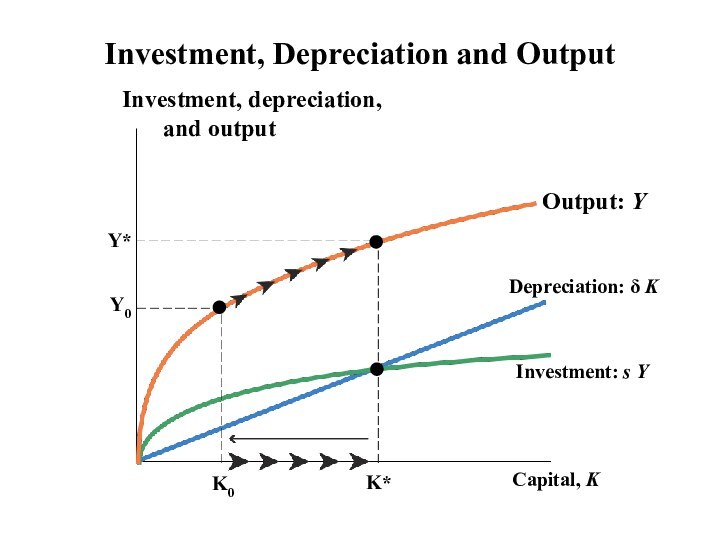
The steady-state level of capital K* is the
level at which investment equals depreciation, indicating that the
amount of capital will not change over time.
Below K* is the level at which investment exceeds depreciation, so the capital stock grows.
Above K*, investment is less than depreciation, so the capital stock shrinks.
In this sense, the steady state represents the long-run equilibrium of the economy.
Слайд 29
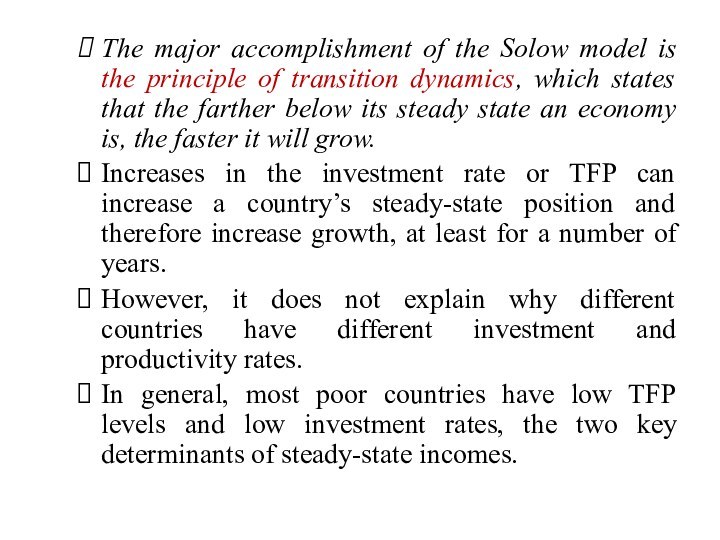
The major accomplishment of the Solow model is
the principle of transition dynamics, which states that the
farther below its steady state an economy is, the faster it will grow.
Increases in the investment rate or TFP can increase a country’s steady-state position and therefore increase growth, at least for a number of years.
However, it does not explain why different countries have different investment and productivity rates.
In general, most poor countries have low TFP levels and low investment rates, the two key determinants of steady-state incomes.
Слайд 30
Investment, Depreciation and Output
Output: Y
Depreciation: δ K
Investment: s
Слайд 31
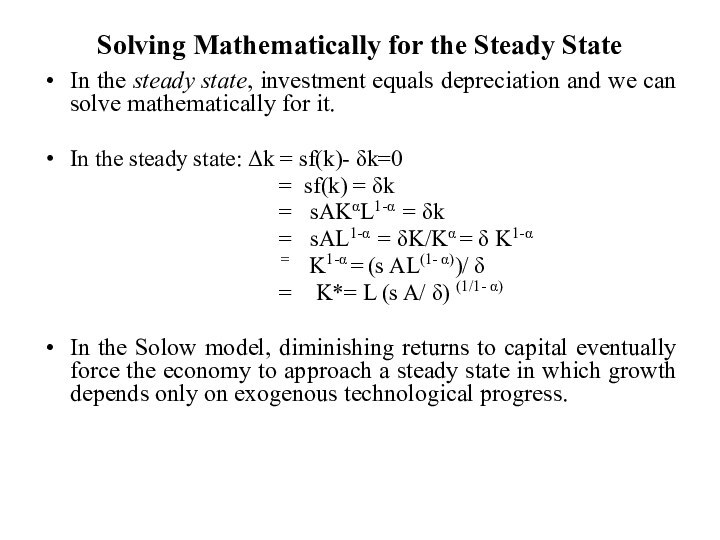
Solving Mathematically for the Steady State
In the steady
state, investment equals depreciation and we can solve mathematically
for it.
In the steady state: Δk = sf(k)- δk=0
= sf(k) = δk
= sAKαL1-α = δk
= sAL1-α = δK/Kα = δ K1-α
= K1-α = (s AL(1- α))/ δ
= K*= L (s A/ δ) (1/1- α)
In the Solow model, diminishing returns to capital eventually force the economy to approach a steady state in which growth depends only on exogenous technological progress.
Слайд 32
Understanding Differences in Growth Rates
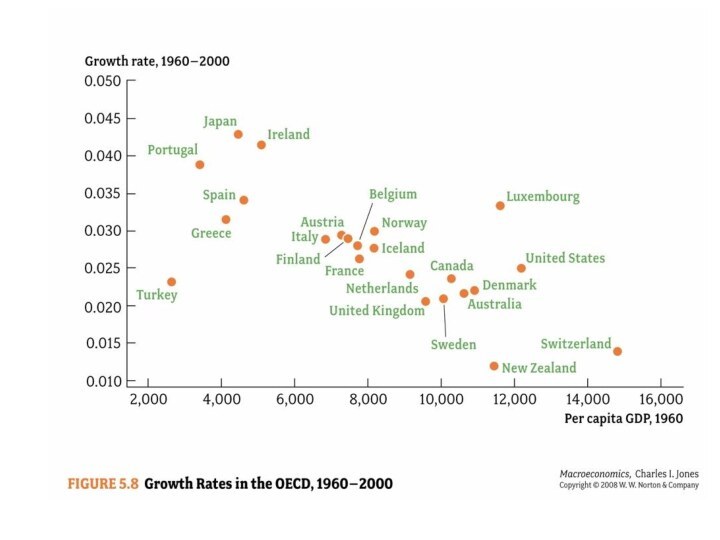
OECD countries that were
relatively poor in 1960 grew quickly while countries that
were relatively rich grew slower.
Solow’s principle of transition dynamics states that the farther below its steady state an economy is, the faster it will grow.
Most poor countries have low TFP levels, low investment rates, and high population growth which are the three key determinants of steady-state incomes.
Countries have more capital because they save a greater part of their income.
Слайд 33
Some Things to Notice
The farther the economy starts
below the steady state level of capital, the faster
the economy initially grows.
Mankiw refers to this as the “catch-up” effect.
This is due to the effect of “diminishing returns”
The amount of extra output from each additional unit of capital goes down as the capital stock gets larger.
If a country is able to increase its productivity, capital will “catch up” quite quickly
Growth slows over time until the capital stock reaches the steady state level.
The Solow model shows that the saving rate is a key determinant of the steady-state capital stock.
However, the rate of saving raises growth only until the economy reaches the new steady state.
Слайд 36
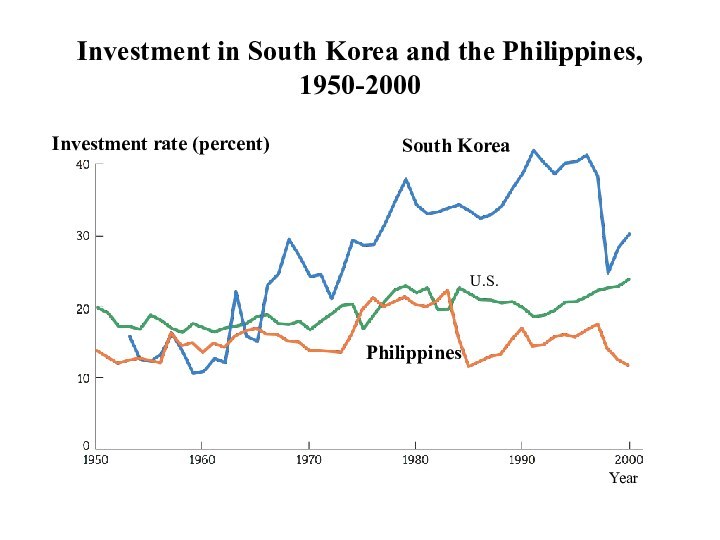
Investment in South Korea and the Philippines,
1950-2000
Слайд 37
Brazil, S. Korea, Philippines
Source: Penn World Table 6.1
(http://pwt.econ.upenn.edu/aboutpwt.html)
Слайд 38
Application: Do Economies Converge?
Unconditional (Absolute) convergence (α-Convergence)
occurs when poor countries will eventually catch up with
the rich countries resulting in similar living standards.
Conditional convergence (β-Convergence):-It will occur, conditional on a number of factors. In other words, it occurs when countries with similar characteristics will converge (savings rate, investment rate, population growth).
No convergence occurs when poor countries do not catch up over time and living standards may diverge.
Слайд 39
Imagine that at the end of their first
year, some students have A averages, whereas others have
C averages. Would you expect the A and C students to converge over the remaining three years of college?
The answer depends on why their first-year grades differed. If the differences arose because some students came from better high schools than others, then you might expect those who were initially disadvantaged to start catching up to their better-prepared peers.
But if the differences arose because some students study more than others, you might expect the differences in grades to persist.
Similarly, if two economies have different steady states, perhaps because the economies have different rates of saving, then we should not expect convergence.
Слайд 40
According to the traditional neoclassical growth theory:
Output
growth results either from increases in labor, increases in
capital, and technological changes.
Closed economies with low savings rates grow slowly in the SR and converge to lower per capita income levels.
Open economies converge at higher levels of per capita income levels.
Traditional neoclassical theory argues that capital flows from rich to poor countries as K-L ratios are lower and investment returns are higher in the latter.
However, in practice, capital flows from rich to rich/poor to rich countries and this is known as the “Lucas paradox.” Why?
Слайд 41
Endogenous Growth Theory
The neo-classical growth theory of Solow
(1956) and Swan (1956) postulates that capital accumulations are
subject to diminishing marginal returns to capital.
Endogenous growth theory (Romer, Lucas) emphasizes different growth opportunities in physical capital and knowledge.
Endogenous growth theory predicts diminishing marginal returns to physical capital, but perhaps not knowledge
The long run growth in GDP per capita in Solow model will depend on TFP growth, which reflects technological progress (which is exogenous in the Solow model).
Technology is exogenous implies that it is not determined within the model (it is exogenous)
Слайд 42
Endogenous growth states that long-run economic growth is
determined by forces that are internal to the economic
system, particularly those forces governing the opportunities and incentives to create technological knowledge.
Endogenous growth theory states technological change arises in large part because of intentional actions taken by people
Endogenous growth theory endogenizes technical change, including human capital, and other forms of knowledge-rich capital in capital stocks.
One drawback of the Solow model is that long-run growth in per capita income is entirely exogenous.
In the absence of exogenous technological growth, income per capita would be static in the long run. This is an implication of diminishing marginal returns to capital.
Слайд 43
To introduce endogenous growth, it is necessary to
have increasing (or at least non-decreasing) returns to capital.
As
in the Solow model, technological change fuels growth.
Technological change arises from research and development (R&D).
Endogenous growth theory rejects the Solow model’s assumption of exogenous technological change.
Advocates of endogenous growth theory argue that the assumption of constant (rather than diminishing) returns to capital is more palatable if ‘K’ is interpreted more broadly; i.e., to view knowledge as a type of capital.
Human capital is the accumulated stock of skills and education
Слайд 44
The largest difference between these two economic growth
models is that the endogenous growth theory argues that
economies do not reach stability, as economies achieve constant returns to capital.
Endogenous growth theory asserts that the rate of economic growth is dependent on whether the country invests in technological or human capital.
In the early 1970s, the rate of growth fell in most industrialized countries. The cause of this slowdown is not well understood.
In the mid-1990s, the rate of growth increased, most likely because of advances in information technology.
A key feature of the endogenous growth model is the absence of diminishing marginal returns to human capital.
This absence of diminishing marginal returns leads to unbounded growth in output per worker.
Endogenous growth theory predicts diminishing marginal returns to physical capital, but perhaps not knowledge.
Слайд 45
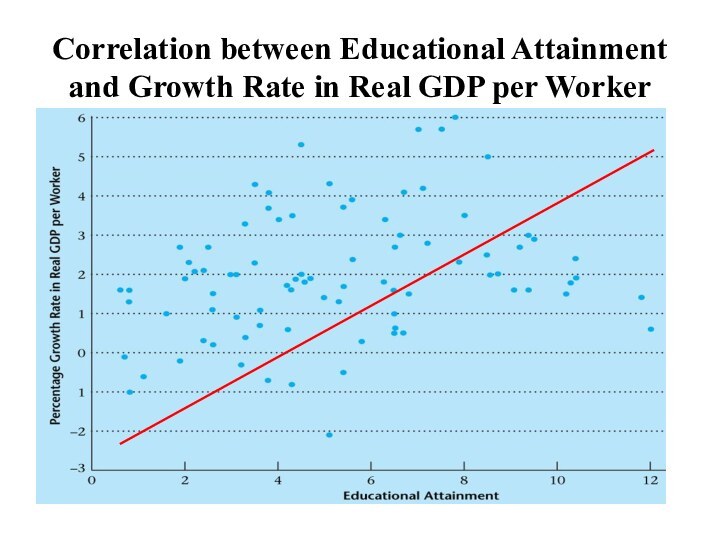
Correlation between Educational Attainment and Growth Rate in
Real GDP per Worker
Слайд 46
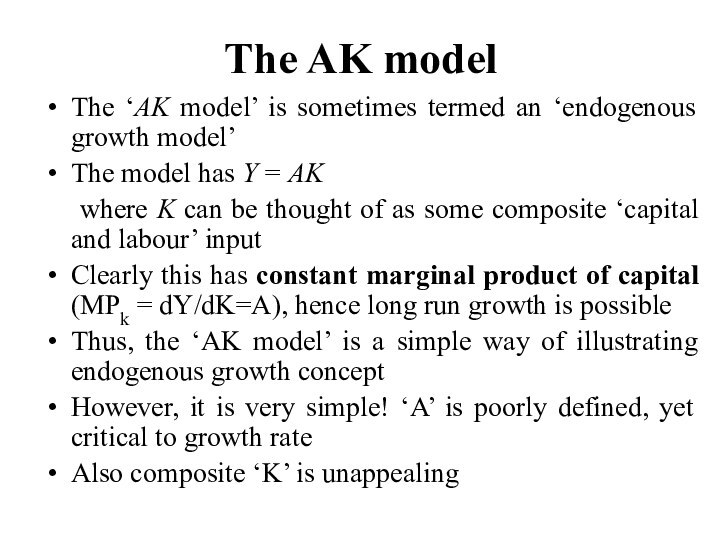
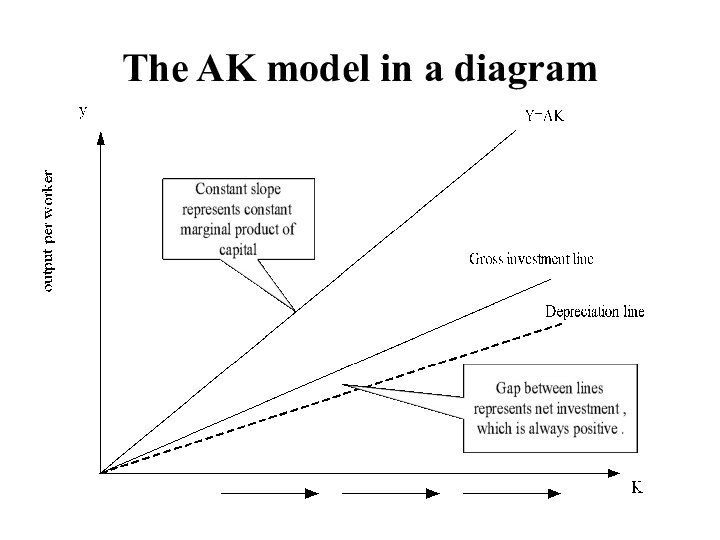
The AK model
The ‘AK model’ is sometimes termed
an ‘endogenous growth model’
The model has Y = AK
where
K can be thought of as some composite ‘capital and labour’ input
Clearly this has constant marginal product of capital (MPk = dY/dK=A), hence long run growth is possible
Thus, the ‘AK model’ is a simple way of illustrating endogenous growth concept
However, it is very simple! ‘A’ is poorly defined, yet critical to growth rate
Also composite ‘K’ is unappealing
Слайд 47
The AK model in a diagram
Where, investment
(i)=s f(k) and depreciation= δ k
Слайд 48
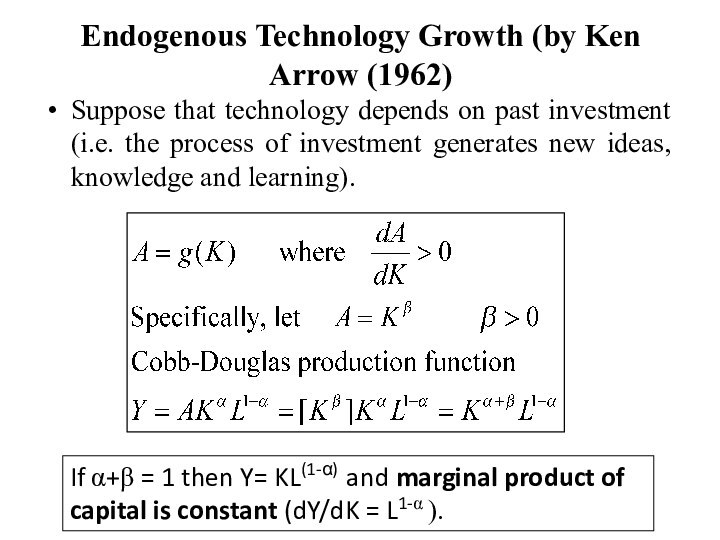
Endogenous Technology Growth (by Ken Arrow (1962)
Suppose
that technology depends on past investment (i.e. the process
of investment generates new ideas, knowledge and learning).
If α+β = 1 then Y= KL(1-α) and marginal product of capital is constant (dY/dK = L1-α ).
Слайд 49
Assuming A=g(K) is Ken Arrow’s (1962) learning-by-doing paper
The
intuition is that learning about technology prevents marginal product
declining.
Слайд 50
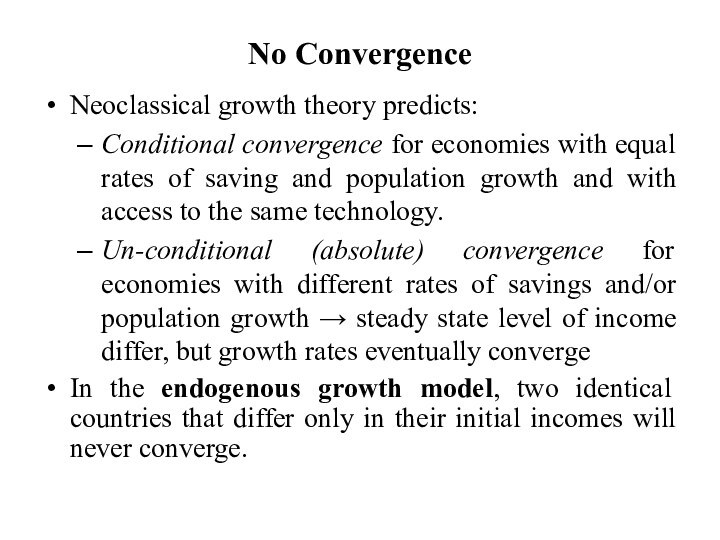
No Convergence
Neoclassical growth theory predicts:
Conditional convergence for
economies with equal rates of saving and population growth
and with access to the same technology.
Un-conditional (absolute) convergence for economies with different rates of savings and/or population growth → steady state level of income differ, but growth rates eventually converge
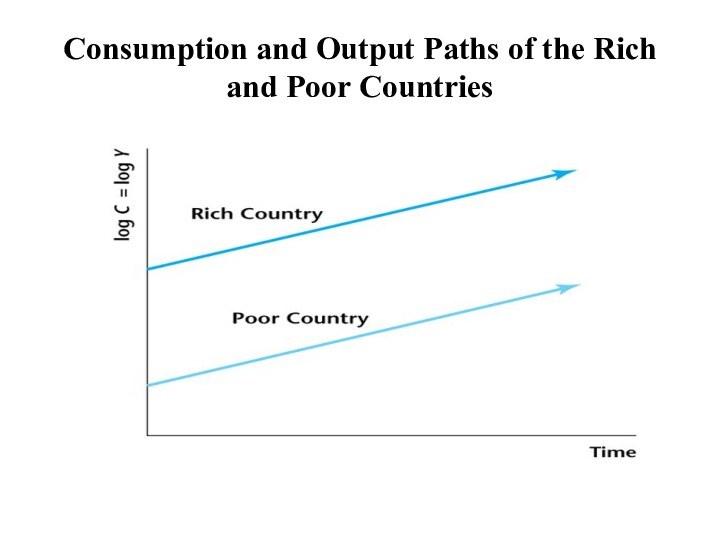
In the endogenous growth model, two identical countries that differ only in their initial incomes will never converge.
Слайд 51
Consumption and Output Paths of the Rich and
Poor Countries
Слайд 52
Convergence
Robert Barro tested these competing theories, and found
that:
Countries with higher levels of investment tend to grow
faster.
The impact of higher investment on growth is however transitory.
Countries with higher investment end in a steady state with higher per capita income, but not with a higher growth rate.
Countries do appear to converge conditionally, and thus endogenous growth theory is not very useful for explaining international differences in growth rates.
Слайд 53
Transformation of the Korean Economy (1945-2005)
Слайд 54
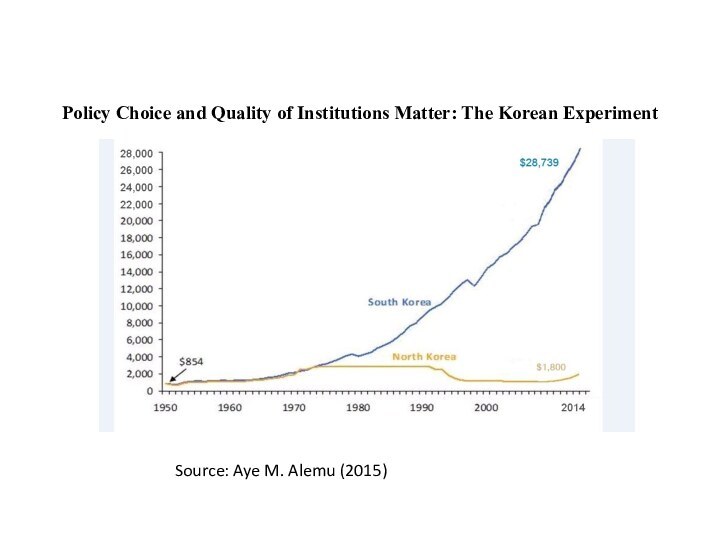
Policy Choice and Quality of Institutions Matter: The
Korean Experiment
Source: Aye M. Alemu (2015)
Слайд 55
Flying geese’ pattern of economic development in East
Asia
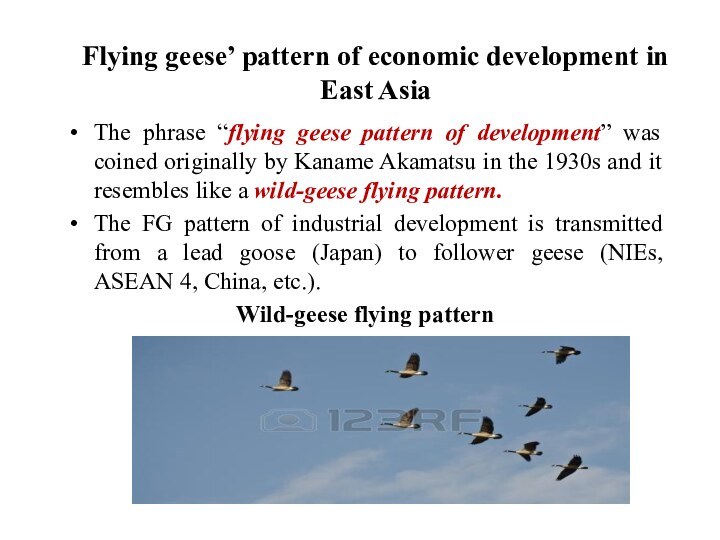
The phrase “flying geese pattern of development” was coined
originally by Kaname Akamatsu in the 1930s and it resembles like a wild-geese flying pattern.
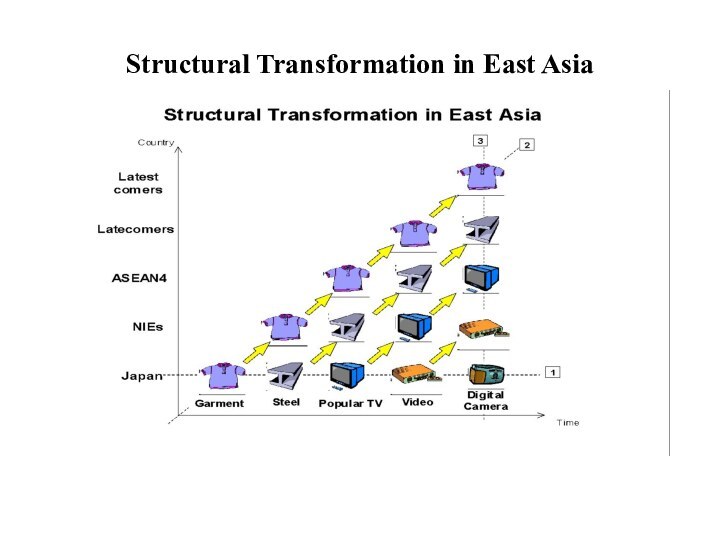
The FG pattern of industrial development is transmitted from a lead goose (Japan) to follower geese (NIEs, ASEAN 4, China, etc.).
Wild-geese flying pattern
Слайд 56
Japan succeeded first in modernizing its economy during
the latter half of the 19th century. Despite the
interruption of World War II, it became virtually the sole developed country in Asia in the 1960s.
The second wave of industrialization in East Asia took place in the Asian NIEs known as the four ‘dragons’ or ‘tigers’ (Taiwan, Korea, Hong Kong and Singapore) from the 1950s to the 1970s.
The third wave of industrialization occurred in the leading ASEAN countries (Malaysia, Thailand, the Philippines and Indonesia) in the 1980s.
The fourth wave of industrialization in the 1990s was led by China, which had industrialized itself by the 1980s, when its opening up to the world economy by Deng Xiaoping.
Vietnam, one of the newcomer ASEAN countries, followed suit and successfully reformed its economy through ‘Doi Moi’ (renovation)
Currently, the wave of industrialization in East Asia has reached Lao PDR and Cambodia.
Слайд 57
Structural Transformation in East Asia
Слайд 58
Are natural resources a limit to growth?
Argument
Natural resources
- will eventually limit how much the world’s economies
can grow
Fixed supply of nonrenewable natural resources – will run out.
Stop economic growth
Force living standards to fall
Слайд 59
Are natural resources a limit to growth?
Technological progress
Often
yields ways to avoid these limits
Improved use of natural
resources over time
Recycling
New materials
Are these efforts enough to permit continued economic growth?
Слайд 60
Are natural resources a limit to growth?
Prices of
natural resources
Scarcity - reflected in market prices
Natural resource prices
Substantial
short-run fluctuations
Stable or falling - over long spans of time
It depends on our ability to conserve these resources.
Слайд 61
Saving and Investment
Raise future productivity
Invest more current resources
in the production of capital.
Trade-off
Devote fewer resources to produce
goods and services for current consumption.
Слайд 62
Higher savings rate
Fewer resources – used to make
consumption goods
More resources – to make capital goods
Capital stock
increases
Rising productivity
More rapid growth in GDP
Слайд 63
Investment from Abroad
Investment from abroad
Another way for a
country to invest in new capital
Foreign direct investment
Capital investment
that is owned and operated by a foreign entity.
Foreign portfolio investment
Investment financed with foreign money but operated by domestic residents.
Слайд 64
Investment from Abroad
Benefits from investment
Some flow back to
the foreign capital owners.
Increase the economy’s stock of capital
Higher
productivity
Higher wages
State-of-the-art technologies
Слайд 65
Investment from Abroad
World Bank
Encourages flow of capital to
poor countries
Funds from world’s advanced countries
Makes loans to less
developed countries
Roads, sewer systems, schools, other types of capital
Advice about how the funds might best be used
Слайд 66
Investment from Abroad
World Bank and the International Monetary
Fund
Set up after World War II
Economic distress leads to:
Political
turmoil, international tensions, and military conflict
Every country has an interest in promoting economic prosperity around the world.
Слайд 67
Education
Education
Investment in human capital
Gap between wages
of educated and uneducated workers
Opportunity cost: wages forgone
Conveys positive
externalities
Public education - large subsidies to human-capital investment
Problem for poor countries: Brain drain
Слайд 68
Health and Nutrition
Human capital
Education
Expenditures that lead to a
healthier population
Healthier workers
More productive
Wages
Reflect a worker’s productivity
Слайд 69
Health and Nutrition
Right investments in the health of
the population
Increase productivity
Raise living standards
Historical trends: long-run economic growth
Improved
health – from better nutrition
Taller workers – higher wages – better productivity
Слайд 70
Health and Nutrition
Vicious circle in poor countries
Poor countries
are poor
Because their populations are not healthy
Populations are not
healthy
Because they are poor and cannot afford better healthcare and nutrition
Слайд 71
Health and Nutrition
Virtuous circle
Policies that lead to more
rapid economic growth
Would naturally improve health outcomes
Which in
turn would further promote economic growth
Слайд 72
Property Rights & Political Stability
To foster economic growth
Protect
property rights
Ability of people to exercise authority over the
resources they own.
Courts – enforce property rights
Promote political stability
Property rights
Prerequisite for the price system to work
Слайд 73
Property Rights & Political Stability
Lack of property rights
Major
problem
Contracts are hard to enforce
Fraud goes unpunished
Corruption
Impedes the coordinating
power of markets
Discourages domestic saving
Discourages investment from abroad
Слайд 74
Property Rights & Political Stability
Political instability
A threat to
property rights
Revolutions and coups
Revolutionary government might confiscate the capital
of some businesses.
Domestic residents - less incentive to save, invest, and start new businesses.
Foreigners - less incentive to invest
Слайд 75
Free Trade
Inward-oriented policies
Avoid interaction with the rest of
the world
Infant-industry argument
Tariffs
Other trade restrictions
Adverse effect on economic growth
Слайд 76
Free Trade
Outward-oriented policies
Integrate into the world economy
International trade
in goods and services
Economic growth
Amount of trade – determined
by
Government policy
Geography
Easier to trade for countries with natural seaports
Слайд 77
Research and Development
Knowledge – public good
Government–encourages research and
development
Farming methods
Aerospace research (Air Force; NASA)
Research grants
National Science
Foundation
National Institutes of Health
Tax breaks
Patent system
Слайд 78
Population Growth
Large population
More workers to produce goods and
services
Larger total output of goods and services
More consumers
Stretching natural
resources
Malthus: an ever-increasing population
Strain society’s ability to provide for itself
Mankind - doomed to forever live in poverty
Слайд 79
Population Growth
Diluting the capital stock
High population growth
Spread the
capital stock more thinly
Lower productivity per worker
Lower GDP
per worker
Reducing the rate of population growth
Government regulation
Increased awareness of birth control
Equal opportunities for women
Слайд 80
Population Growth
Promoting technological progress
World population growth
Engine for technological
progress and economic prosperity
More people = More scientists, more
inventors, more engineers
Слайд 81
Summary
International differences in income per person can be
attributed to either:
differences in the factors of production,
such as the quantities of physical and human capital, or
Differences in the efficiency with which economies use their factors of production.
A final hypothesis is that both factor accumulation and production efficiency are driven by a common third variable: quality of the nation’s institutions , including the government’s policymaking process.
Bad policies such as high inflation, excessive budget deficits, widespread market interference, and rampant corruption, often go hand in hand.
Слайд 82
Summary
The Solow growth model has emphasized the importance
of savings or investment ratio as the main determinant
of short-run economic growth.
The neo-classical growth theory of Solow (1956) and Swann (1956) postulates that capital accumulations are subject to diminishing returns.
The long run growth in GDP per capita, will depend on TFP growth, which reflects technological progress.
In the absence of exogenous technological growth, income per capita would be static in the long run.
Слайд 83
Technological progress, though important in the long-run, is
regarded as exogenous to the economic system.
The Solow Model
predicts catch-up growth (convergence in growth rate) on the basis that poor economies will grow faster compared to rich ones.
One drawback of the Solow model is that long-run growth in per capita income is entirely exogenous.
Слайд 84
Investment, Depreciation and Output
Output: Y
Depreciation: δ K
Investment: s
Слайд 85
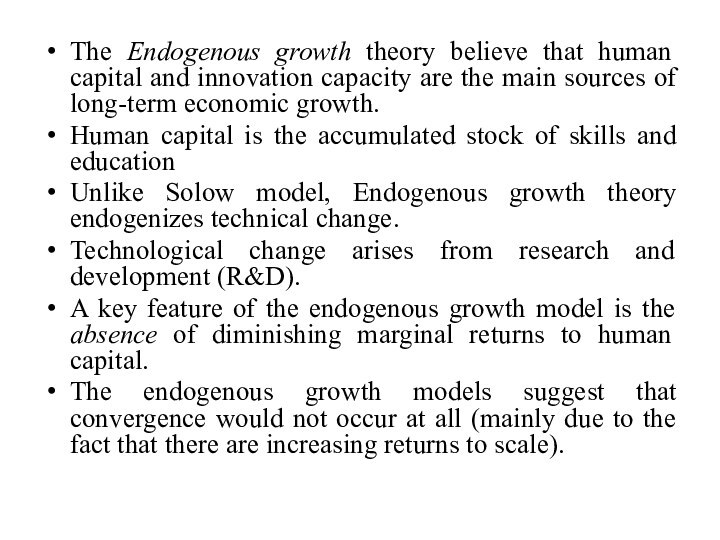
The Endogenous growth theory believe that human capital
and innovation capacity are the main sources of long-term
economic growth.
Human capital is the accumulated stock of skills and education
Unlike Solow model, Endogenous growth theory endogenizes technical change.
Technological change arises from research and development (R&D).
A key feature of the endogenous growth model is the absence of diminishing marginal returns to human capital.
The endogenous growth models suggest that convergence would not occur at all (mainly due to the fact that there are increasing returns to scale).
Слайд 87
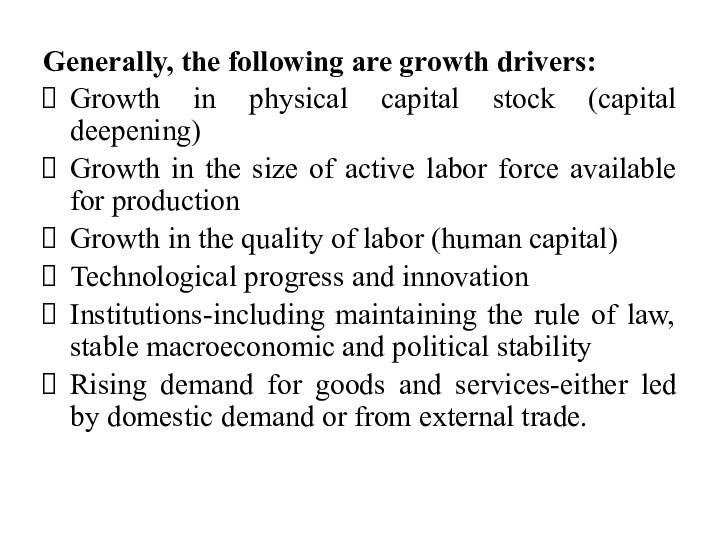
Generally, the following are growth drivers:
Growth in physical
capital stock (capital deepening)
Growth in the size of active
labor force available for production
Growth in the quality of labor (human capital)
Technological progress and innovation
Institutions-including maintaining the rule of law, stable macroeconomic and political stability
Rising demand for goods and services-either led by domestic demand or from external trade.
