Слайд 2
Agenda
Exception Handling
Debugging Code in Browser
Using Console API
Useful links
Слайд 4
Errors are Natural
Any software solution faces errors: invalid
user input, broken connection or bugs in code
Errors break
normal flow of the program execution and may lead to fatal results in case if not handled properly
www.fasticon.com
Слайд 5
What is Exception and Exception Handling?
Exception – is
an event, which occurs during the execution of a
program, that disrupts the normal flow of the program's instructions.
Exception handling is convenient way to handle errors
normal flow:
exception handling:
exception
Слайд 6
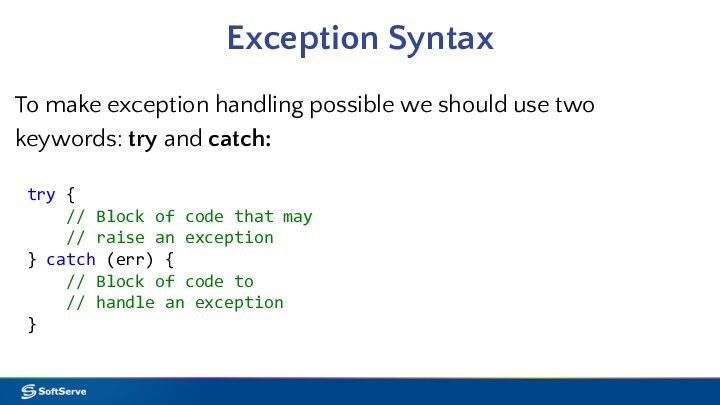
Exception Syntax
To make exception handling possible we should
use two keywords: try and catch:
try {
//
Block of code that may
// raise an exception
} catch (err) {
// Block of code to
// handle an exception
}
Слайд 7
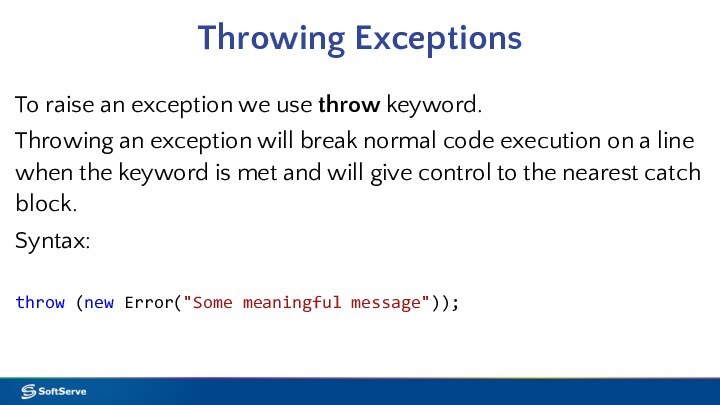
Throwing Exceptions
To raise an exception we use throw
keyword.
Throwing an exception will break normal code execution on
a line when the keyword is met and will give control to the nearest catch block.
Syntax:
throw (new Error("Some meaningful message"));
Слайд 8
Exception Handling Sample
In a sample below we ask
the user to enter age and convert it to
a number. If conversion returns NaN we throw an exception and handle it with catch block.
Note that JS itself does not throws exceptions on math errors, its returns NaN
01 var age = parseInt(window.prompt("Enter your age"));
02 try {
03 if (isNaN(age))
04 throw (new Error("You entered incorrect value!"));
05 var nextAge = age + 10;
06 alert("In ten years you will be " + nextAge);
07 }
08 catch (err) {
09 alert(err.message);
10 }
Слайд 9
Using finally keyword
Keyword finally is used in try..catch
construction to define block of code that is called
whenever exception occurs or not.
The main purpose of it is to free resources allocated just before try keyword
try {
// Block of code that may raise an exception
} catch (err) {
// Block of code to handle an exception
} finally {
// Block of code that called whenever
// exception occurs or not
}
Слайд 10
Method .onerror()
Method window.onerror() called each time when unhandled
exception occurs.
The .onerror() event handler provides three pieces of information to
identify the exact nature of the error:
Error message. The same message that the browser would display for the given error
URL. The file in which the error occurred
Line number. The line number in the given URL that caused the error
Слайд 11
Sample .onerror() handler
In a sample below we assign
.onerror() event handler that is called on button click
because there is no function as myFunc() defined on the page:
Click the following to see the result:
Слайд 13
What is Debugging?
Debugging is a process of searching
and removing bugs from the code
The process of debugging
might be not easy and sometimes becomes very tricky
Writing clean, well-documented code that conforms coding conventions greatly simplifies debugging process
Most modern browsers have built-in tools or addons for debugging JavaScript code
Слайд 14
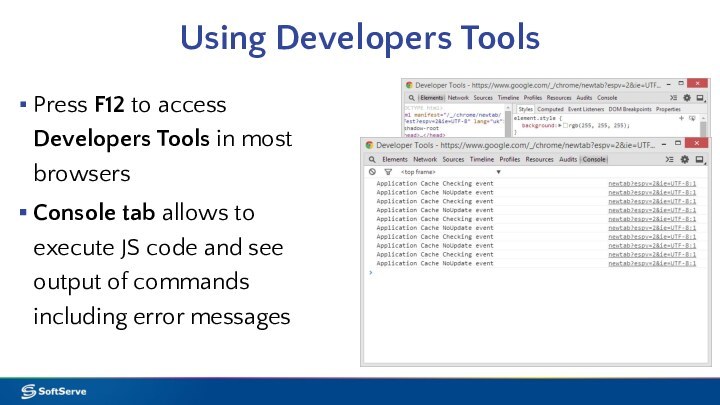
Using Developers Tools
Press F12 to access Developers Tools
in most browsers
Console tab allows to execute JS
code and see output of commands including error messages
Слайд 15
Code Executions Controls in Chrome Browser
Google Chrome browser
provides full-featured debugger that has execution control buttons
Opening Sources
tab allows to choose JS code of a solution in external files as well as in inside html file
Слайд 16
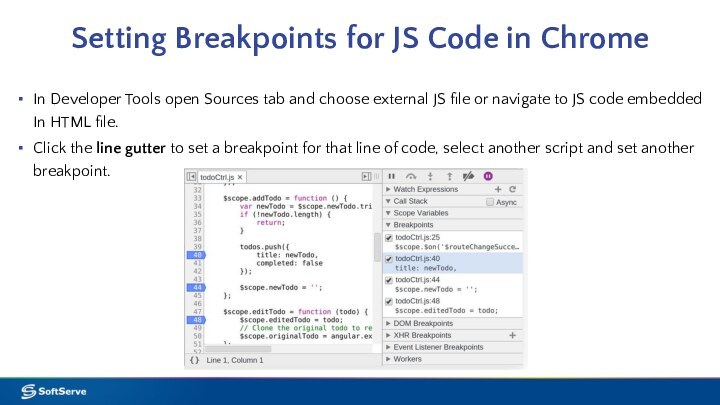
Setting Breakpoints for JS Code in Chrome
In
Developer Tools open Sources tab and choose external JS
file or navigate to JS code embedded In HTML file.
Click the line gutter to set a breakpoint for that line of code, select another script and set another breakpoint.
Слайд 17
Execution Control Buttons in Chrome
Continue: continues code execution to
another breakpoint.
Step over: step through code line-by-line, do not enters
functions
Step into: acts like Step over, however clicking Step into at the function call will cause the debugger to move its execution to the first line in the functions definition.
Step out: allows to run current function till the end move debugger's execution to the parent function.
Toggle breakpoints: toggles breakpoints on/off while leaving their enabled states intact.
Слайд 18
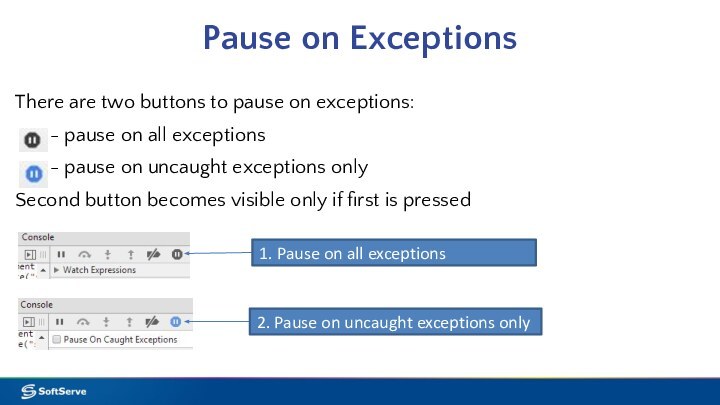
Pause on Exceptions
There are two buttons to pause
on exceptions:
- pause on
all exceptions
- pause on uncaught exceptions only
Second button becomes visible only if first is pressed
1. Pause on all exceptions
2. Pause on uncaught exceptions only
Слайд 19
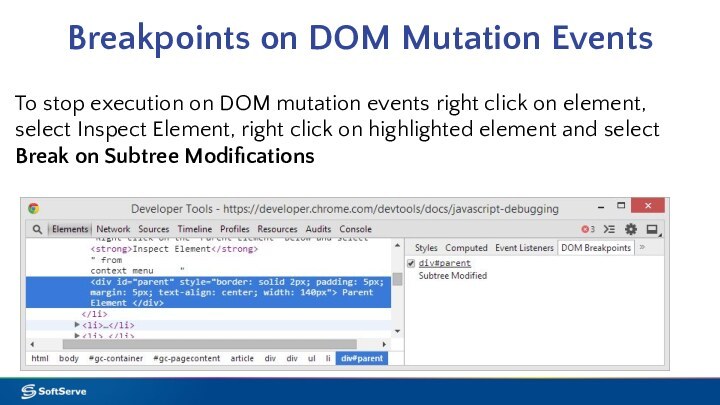
Breakpoints on DOM Mutation Events
To stop execution on
DOM mutation events right click on element, select Inspect
Element, right click on highlighted element and select Break on Subtree Modifications
Слайд 20
Breakpoints on XMLHttpRequest Events
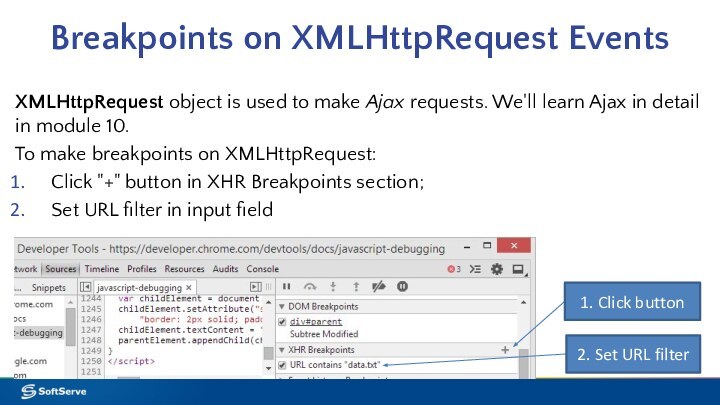
XMLHttpRequest object is used to
make Ajax requests. We'll learn Ajax in detail in
module 10.
To make breakpoints on XMLHttpRequest:
Click "+" button in XHR Breakpoints section;
Set URL filter in input field
1. Click button
2. Set URL filter
Слайд 21
Breakpoints on JavaScript Event Listeners
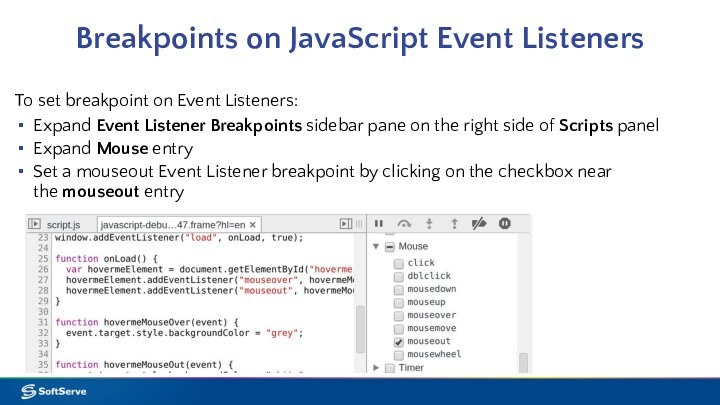
To set breakpoint on
Event Listeners:
Expand Event Listener Breakpoints sidebar pane on the right side
of Scripts panel
Expand Mouse entry
Set a mouseout Event Listener breakpoint by clicking on the checkbox near the mouseout entry
Слайд 23
Console object
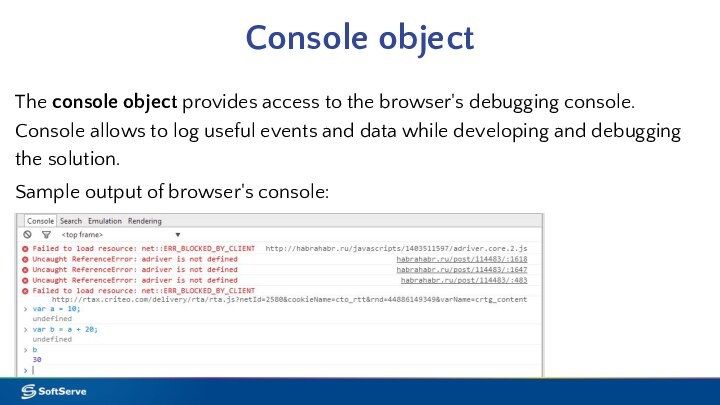
The console object provides access to the
browser's debugging console. Console allows to log useful events
and data while developing and debugging the solution.
Sample output of browser's console:
Слайд 24
Useful Methods
Useful methods of console object:
.log() – general
output of logging information
.info(), .warn(), .error() – same as
log() but add notification icons
.dir() – shows specific JS object
.dirxml() – shows xml code or html code of DOM element
.group(), .groupCollapsed(), .groupEnd() – grouping output
.time(), .timeEnd() – setting timer
.profile(), .profileEnd() – using profiling tools
.assert() – asserting conditions
Слайд 25
Method .log()
Method .log() used for general output of
logging information
Method accepts any number of arguments
It is
possible to use string formatting commands (%s – string, %d – decimal, %i – integer, %f – floating point)
Sample:
console.log('Hello, my name is %s, my age is %i', 'John', 20);
> Hello, my name is John, my age is 20
Слайд 26
Methods .info(), .warn(), .error()
Methods .info(), .warn(), .error()
act almost as .log() but add icons to console
output that allows to distinguish between different type of output
Слайд 27
Methods .dirxml() and .dir()
Method .dirxml() – shows xml
code or html code of DOM element, .dir() –
shows specific JS object :
Слайд 28
Grouping Console Output
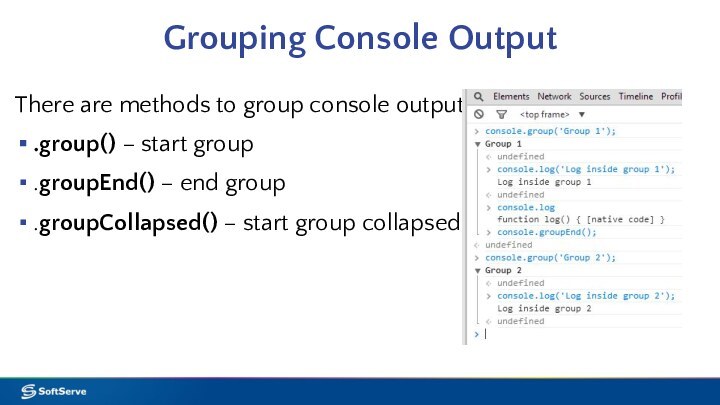
There are methods to group console
output:
.group() – start group
.groupEnd() – end group
.groupCollapsed() – start
group collapsed
Слайд 29
Setting Timer
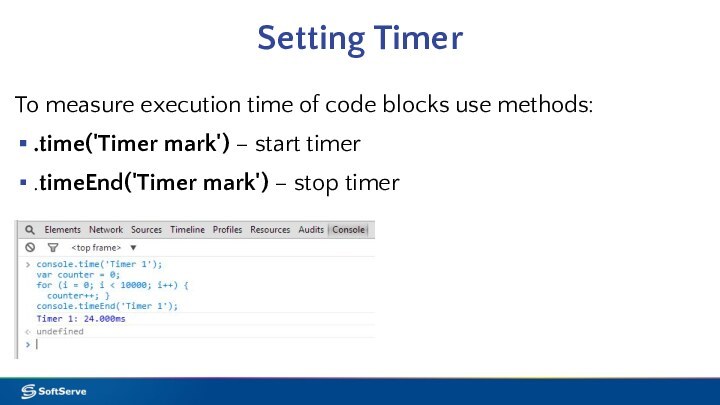
To measure execution time of code blocks
use methods:
.time('Timer mark') – start timer
.timeEnd('Timer mark') – stop
timer
Слайд 30
Profiling Code
To display profiling stack use methods:
.profile() –
start profiler
.profileEnd() – stop profiler
access profiling results here
Слайд 31
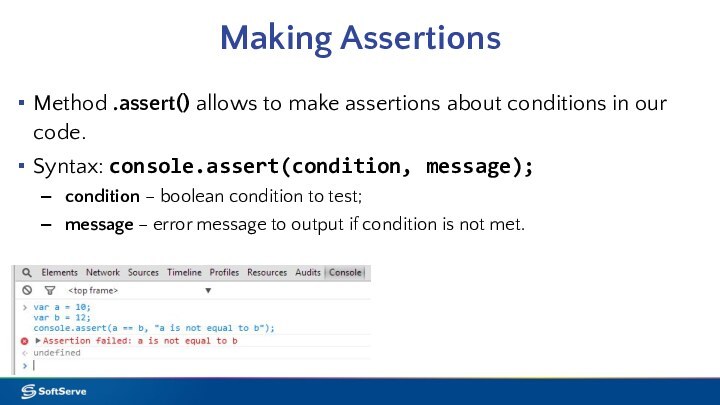
Making Assertions
Method .assert() allows to make assertions about
conditions in our code.
Syntax: console.assert(condition, message);
condition – boolean condition
to test;
message – error message to output if condition is not met.
Слайд 32
Best Practices
Assume your code will fail
Log errors to
the server
You, not the browser, handle errors
Identify where errors
might occur
Throw your own errors
Distinguish fatal versus non-fatal errors
Provide a debug mode
Слайд 34
Links
JavaScript Errors on W3Schools.com: http://www.w3schools.com/js/js_errors.asp
Error object on
MDN: https://developer.mozilla.org/en-US/docs/Web/JavaScript/Reference/Global_Objects/Error
Enterprise JavaScript Error Handling: http://www.slideshare.net/nzakas/enterprise-javascript-error-handling-presentation
Debugging JavaScript
in Google Chrome: https://developer.chrome.com/devtools/docs/javascript-debugging#breakpoints-dynamic-javascript
