- Главная
- Разное
- Бизнес и предпринимательство
- Образование
- Развлечения
- Государство
- Спорт
- Графика
- Культурология
- Еда и кулинария
- Лингвистика
- Религиоведение
- Черчение
- Физкультура
- ИЗО
- Психология
- Социология
- Английский язык
- Астрономия
- Алгебра
- Биология
- География
- Геометрия
- Детские презентации
- Информатика
- История
- Литература
- Маркетинг
- Математика
- Медицина
- Менеджмент
- Музыка
- МХК
- Немецкий язык
- ОБЖ
- Обществознание
- Окружающий мир
- Педагогика
- Русский язык
- Технология
- Физика
- Философия
- Химия
- Шаблоны, картинки для презентаций
- Экология
- Экономика
- Юриспруденция
Что такое findslide.org?
FindSlide.org - это сайт презентаций, докладов, шаблонов в формате PowerPoint.
Обратная связь
Email: Нажмите что бы посмотреть
Презентация на тему Hypothesis testing
Содержание
- 2. Steps in Hypothesis Testing
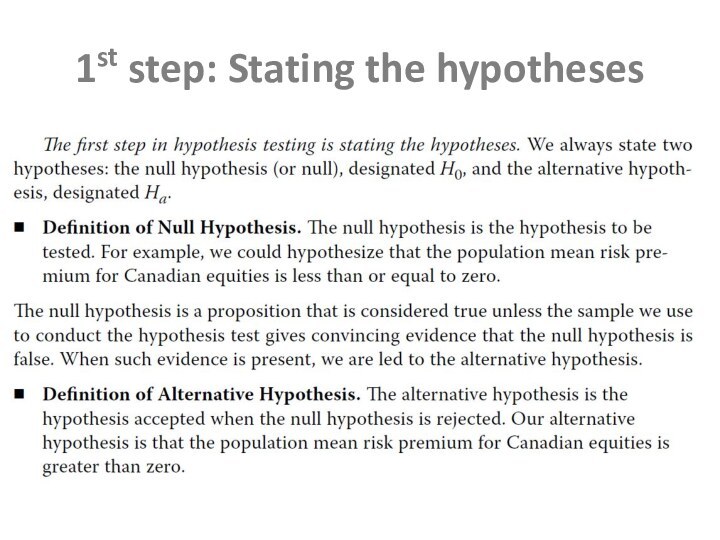
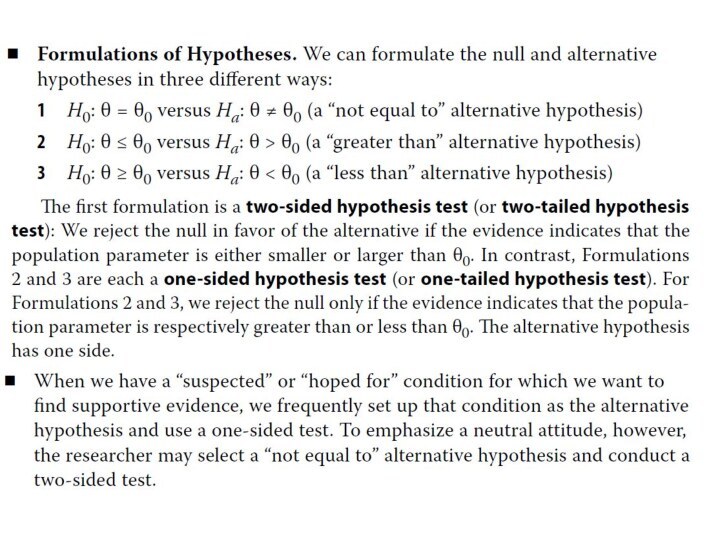
- 3. 1st step: Stating the hypotheses
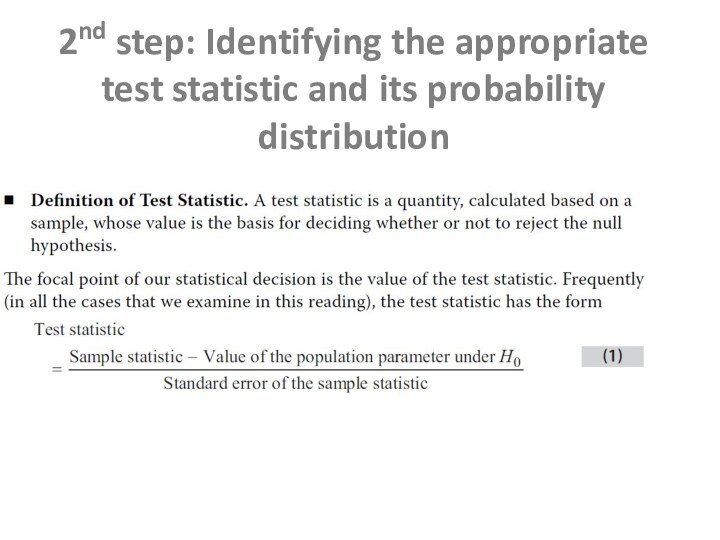
- 5. 2nd step: Identifying the appropriate test statistic and its probability distribution
- 6. 3rd: Specifying the significance levelThe level of
- 7. 4th: Stating the decision ruleA decision rule
- 8. 5th: Collecting the data and calculating the
- 9. p-ValueThe p-value is the smallest level of
- 10. Tests Concerning a Single MeanFor hypothesis tests
- 12. The z-Test Alternative
- 14. Tests Concerning Differences between MeansWhen we want
- 17. Tests Concerning Mean DifferencesIn tests concerning two
- 20. Tests Concerning a Single VarianceIn tests concerning
- 21. Rejection Points for Hypothesis Tests on the Population Variance.
- 22. Tests Concerning the Equality (Inequality) of Two
- 25. NONPARAMETRIC INFERENCEA parametric test is a hypothesis
- 26. Tests Concerning Correlation: The Spearman Rank Correlation
- 27. Скачать презентацию
- 28. Похожие презентации
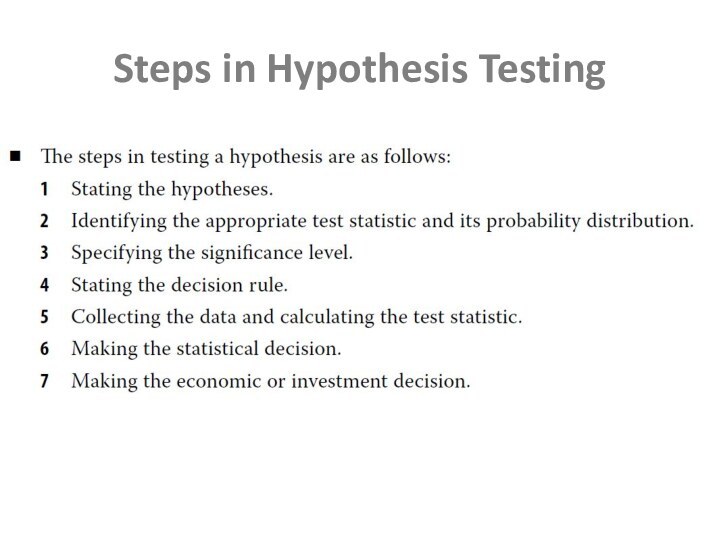
Steps in Hypothesis Testing
Слайд 6
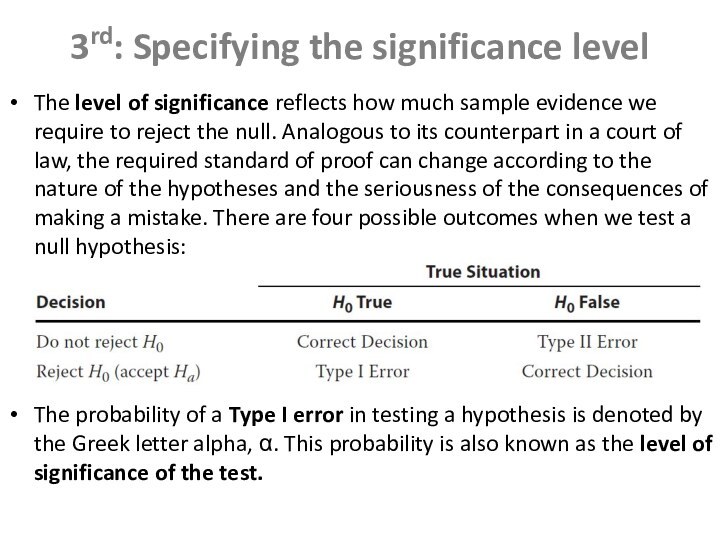
3rd: Specifying the significance level
The level of significance
reflects how much sample evidence we require to reject
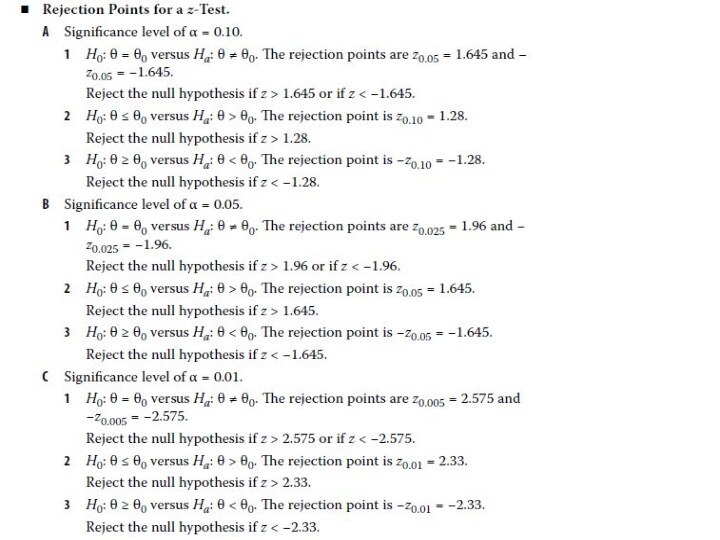
the null. Analogous to its counterpart in a court of law, the required standard of proof can change according to the nature of the hypotheses and the seriousness of the consequences of making a mistake. There are four possible outcomes when we test a null hypothesis:The probability of a Type I error in testing a hypothesis is denoted by the Greek letter alpha, α. This probability is also known as the level of significance of the test.
Слайд 7
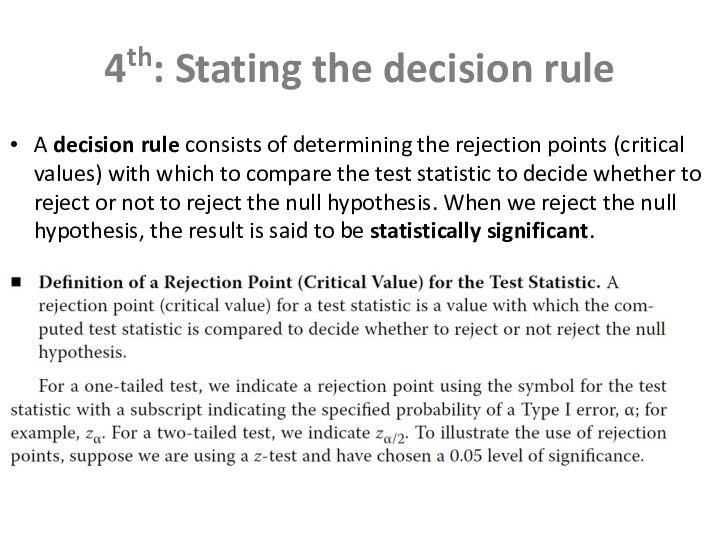
4th: Stating the decision rule
A decision rule consists
of determining the rejection points (critical values) with which
to compare the test statistic to decide whether to reject or not to reject the null hypothesis. When we reject the null hypothesis, the result is said to be statistically significant.Слайд 8 5th: Collecting the data and calculating the test
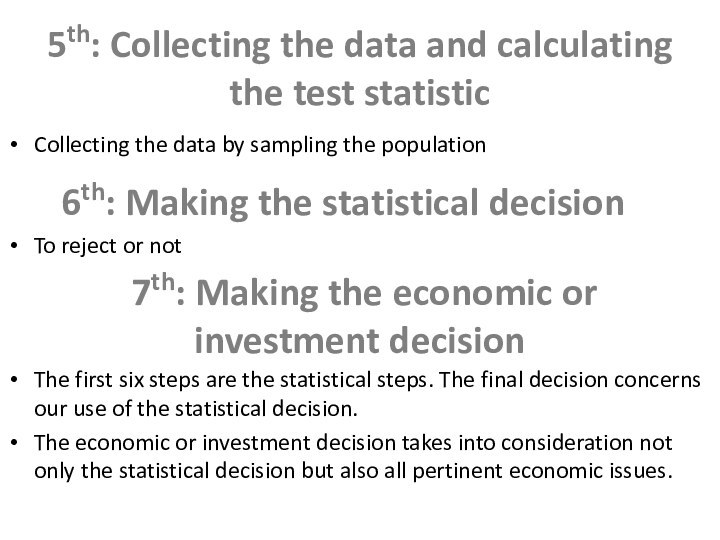
statistic
Collecting the data by sampling the population
To reject or
notThe first six steps are the statistical steps. The final decision concerns our use of the statistical decision.
The economic or investment decision takes into consideration not only the statistical decision but also all pertinent economic issues.
6th: Making the statistical decision
7th: Making the economic or investment decision
Слайд 9
p-Value
The p-value is the smallest level of significance
at which the null hypothesis can be rejected. The
smaller the p-value, the stronger the evidence against the null hypothesis and in favor of the alternative hypothesis. The p-value approach to hypothesis testing does not involve setting a significance level; rather it involves computing a p-value for the test statistic and allowing the consumer of the research to interpret its significance.
Слайд 10
Tests Concerning a Single Mean
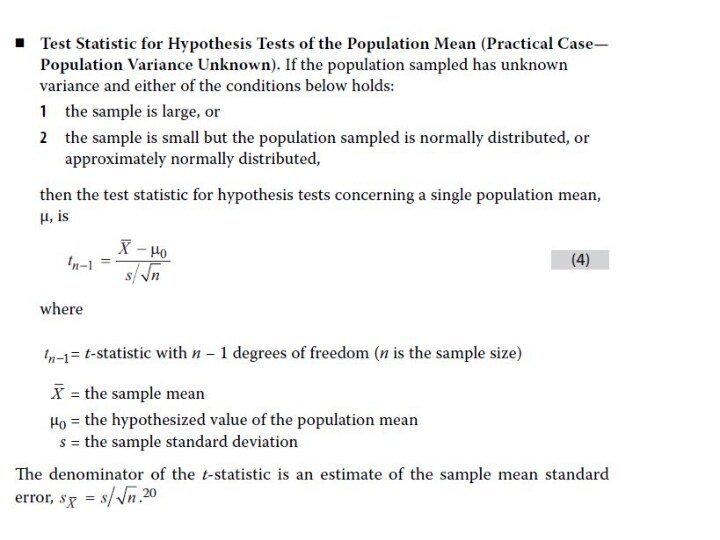
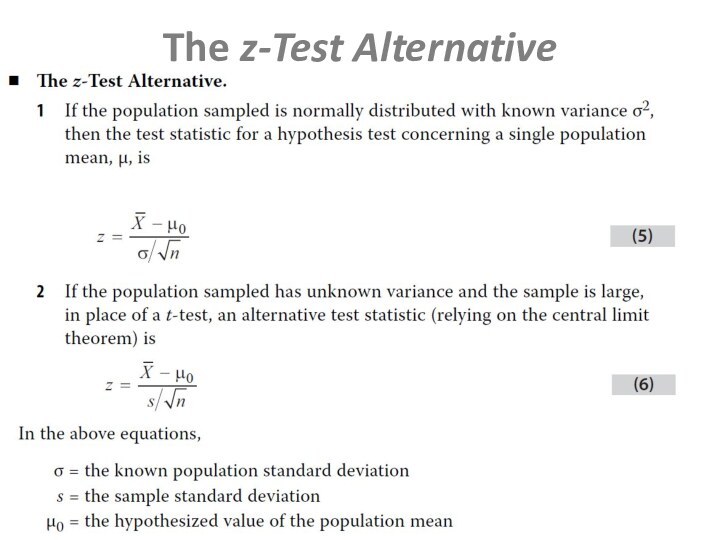
For hypothesis tests concerning
the population mean of a normally distributed population with
unknown (known) variance, the theoretically correct test statistic is the t-statistic (z-statistic). In the unknown variance case, given large samples (generally, samples of 30 or more observations), the z-statistic may be used in place of the t-statistic because of the force of the central limit theorem.The t-distribution is a symmetrical distribution defined by a single parameter: degrees of freedom. Compared to the standard normal distribution, the t-distribution has fatter tails.
Слайд 14
Tests Concerning Differences between Means
When we want to
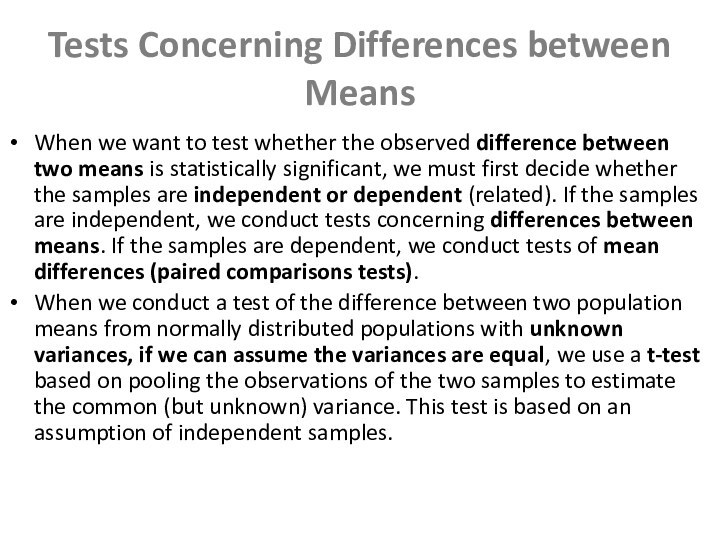
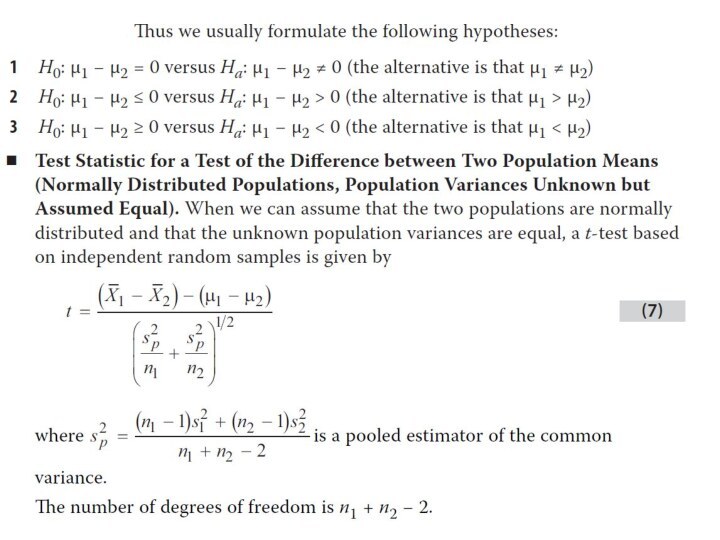
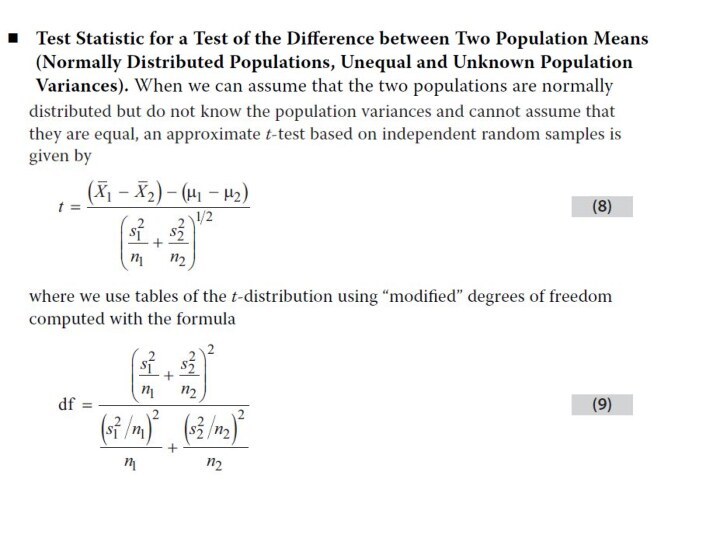
test whether the observed difference between two means is
statistically significant, we must first decide whether the samples are independent or dependent (related). If the samples are independent, we conduct tests concerning differences between means. If the samples are dependent, we conduct tests of mean differences (paired comparisons tests).When we conduct a test of the difference between two population means from normally distributed populations with unknown variances, if we can assume the variances are equal, we use a t-test based on pooling the observations of the two samples to estimate the common (but unknown) variance. This test is based on an assumption of independent samples.
Слайд 17
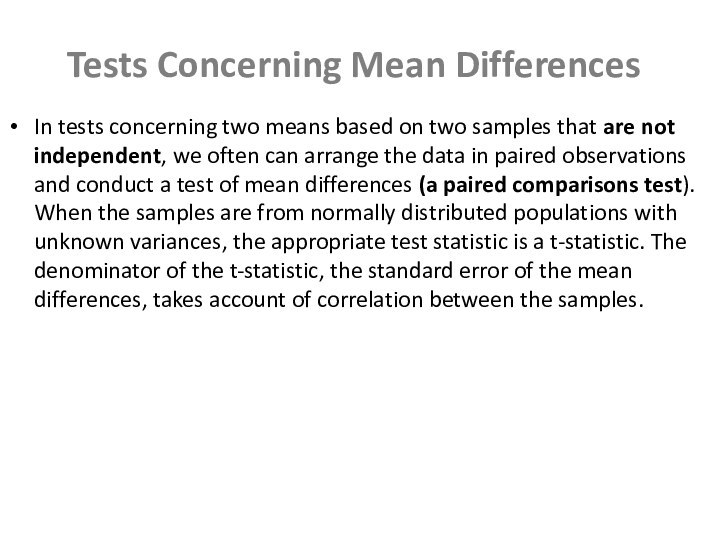
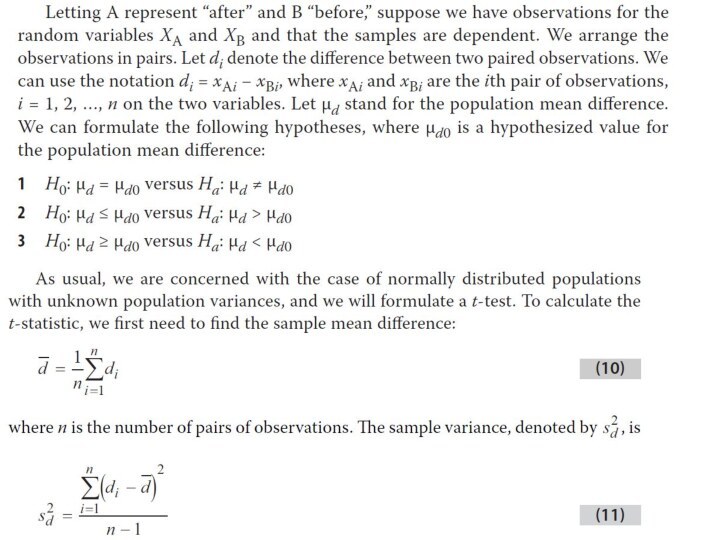
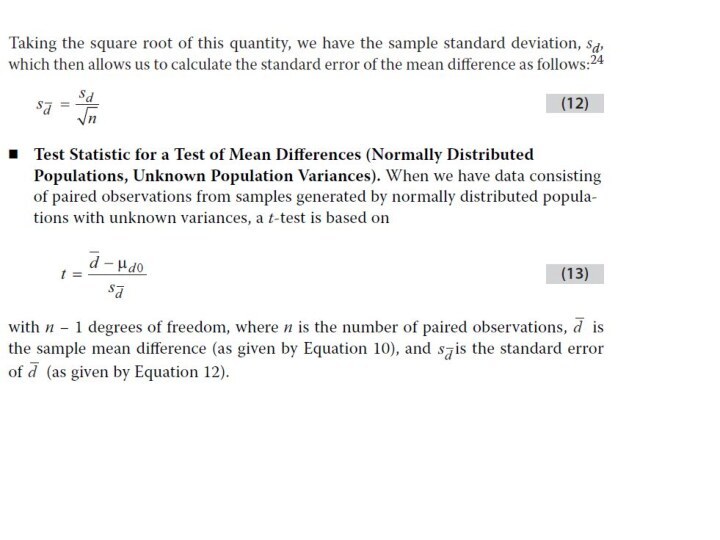
Tests Concerning Mean Differences
In tests concerning two means
based on two samples that are not independent, we
often can arrange the data in paired observations and conduct a test of mean differences (a paired comparisons test). When the samples are from normally distributed populations with unknown variances, the appropriate test statistic is a t-statistic. The denominator of the t-statistic, the standard error of the mean differences, takes account of correlation between the samples.
Слайд 20
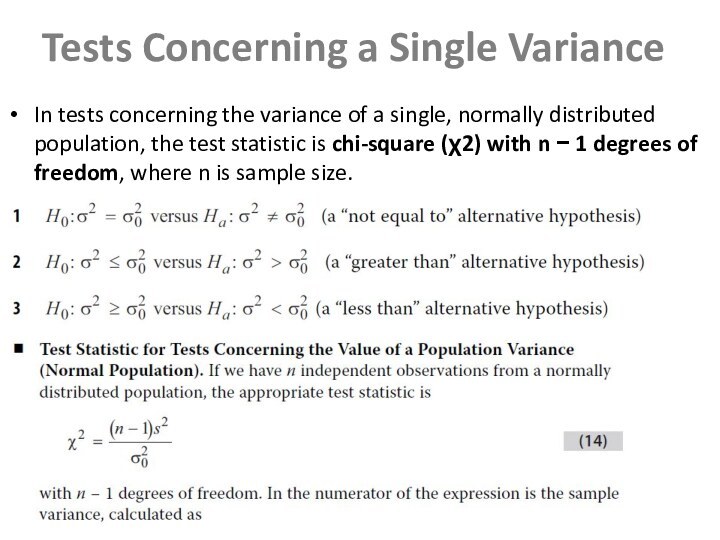
Tests Concerning a Single Variance
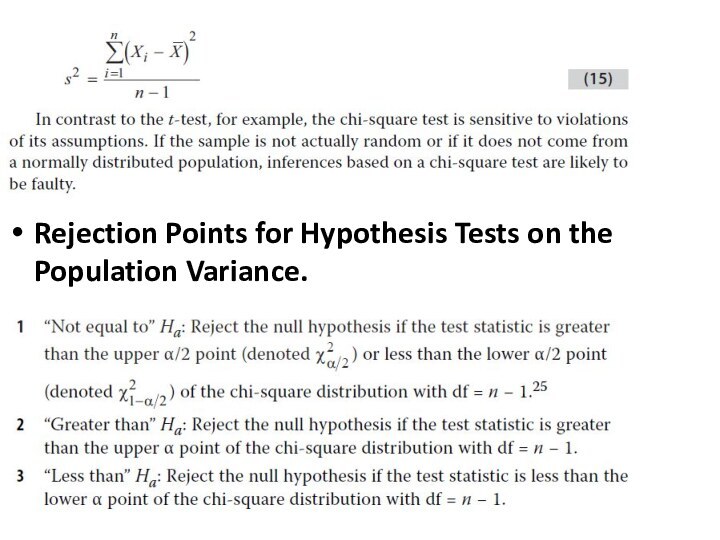
In tests concerning the
variance of a single, normally distributed population, the test
statistic is chi-square (χ2) with n − 1 degrees of freedom, where n is sample size.
Слайд 22
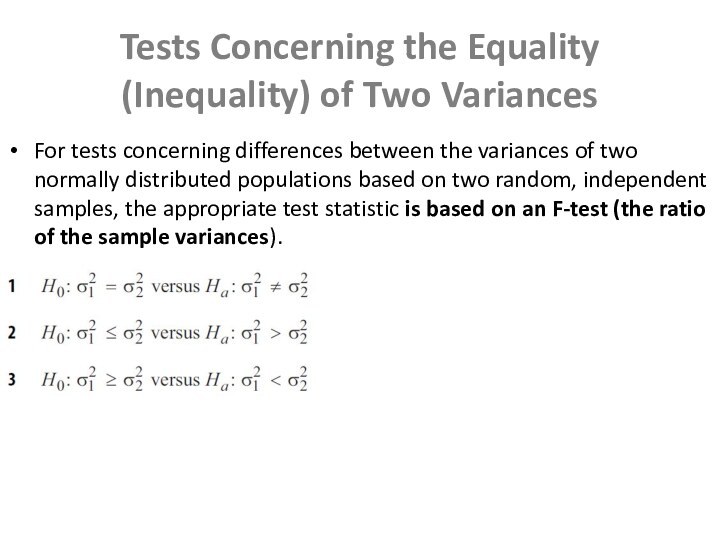
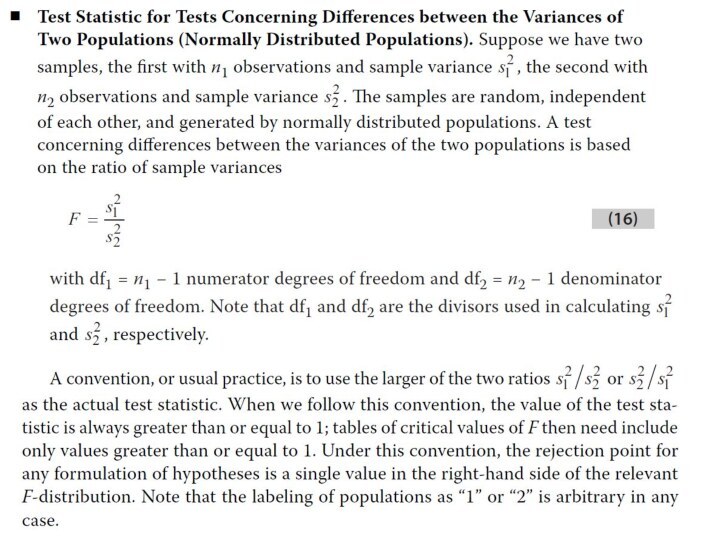
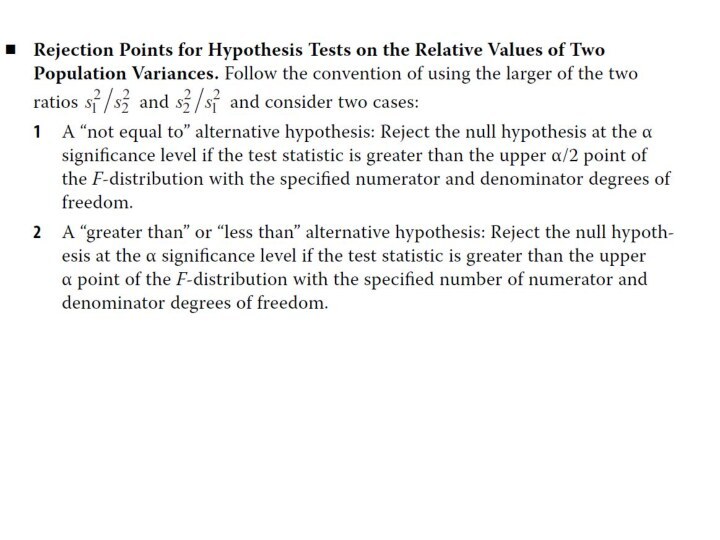
Tests Concerning the Equality (Inequality) of Two Variances
For
tests concerning differences between the variances of two normally
distributed populations based on two random, independent samples, the appropriate test statistic is based on an F-test (the ratio of the sample variances).
Слайд 25
NONPARAMETRIC INFERENCE
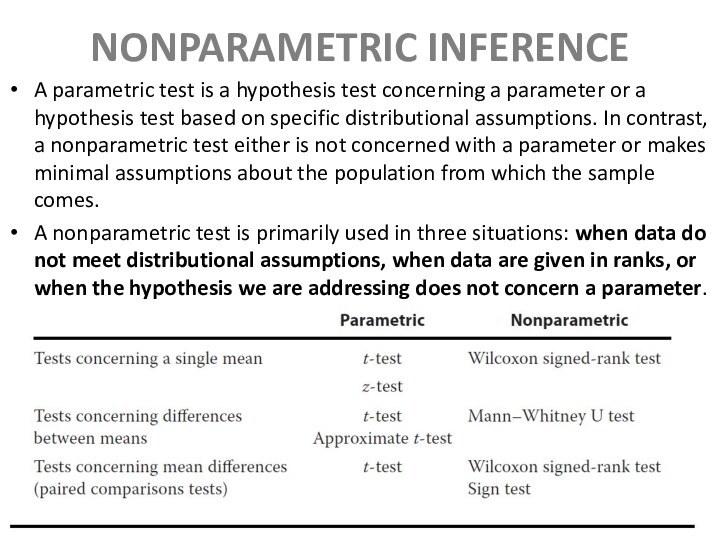
A parametric test is a hypothesis test
concerning a parameter or a hypothesis test based on
specific distributional assumptions. In contrast, a nonparametric test either is not concerned with a parameter or makes minimal assumptions about the population from which the sample comes.A nonparametric test is primarily used in three situations: when data do not meet distributional assumptions, when data are given in ranks, or when the hypothesis we are addressing does not concern a parameter.


