- Главная
- Разное
- Бизнес и предпринимательство
- Образование
- Развлечения
- Государство
- Спорт
- Графика
- Культурология
- Еда и кулинария
- Лингвистика
- Религиоведение
- Черчение
- Физкультура
- ИЗО
- Психология
- Социология
- Английский язык
- Астрономия
- Алгебра
- Биология
- География
- Геометрия
- Детские презентации
- Информатика
- История
- Литература
- Маркетинг
- Математика
- Медицина
- Менеджмент
- Музыка
- МХК
- Немецкий язык
- ОБЖ
- Обществознание
- Окружающий мир
- Педагогика
- Русский язык
- Технология
- Физика
- Философия
- Химия
- Шаблоны, картинки для презентаций
- Экология
- Экономика
- Юриспруденция
Что такое findslide.org?
FindSlide.org - это сайт презентаций, докладов, шаблонов в формате PowerPoint.
Обратная связь
Email: Нажмите что бы посмотреть
Презентация на тему Overview of the U.S. Health Care System
Содержание
- 2. CoverageHealth Insurance Coverage of the Non-elderly Population,
- 3. Profile of the uninsured47.0 million Americans81% from
- 4. Employer-sponsored insuranceOffered by employers as part of
- 5. Individual insurancePurchased directly by people who do
- 6. MedicareCovers elderly (ages 65 and older) and
- 7. Medicare Four parts:Part A – hospital insurancePart
- 8. MedicaidCovers certain low-income individuals; not every poor
- 9. State Children’s Health Insurance Program (S-CHIP)Supplements Medicaid
- 10. Other public insurance programs Veterans Health AdministrationHealth
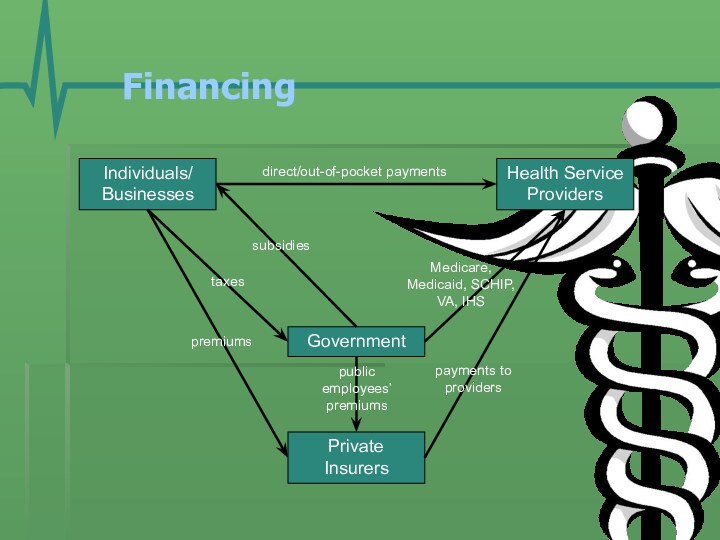
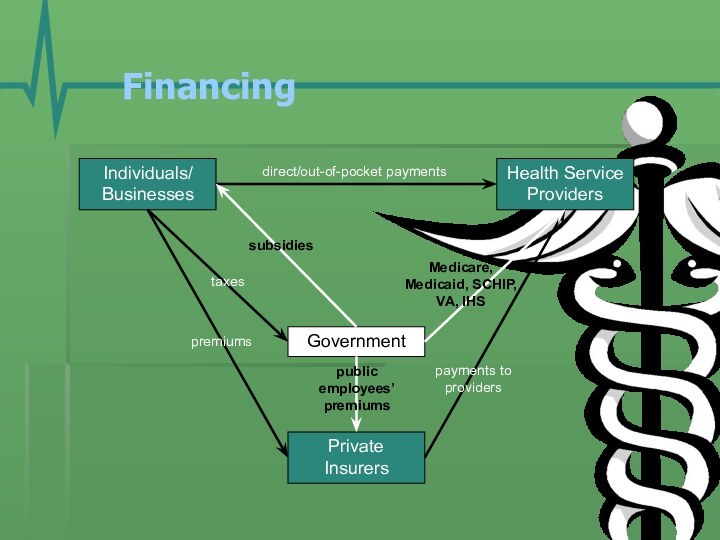
- 11. Financing Individuals/BusinessesGovernmentHealth Service ProvidersPrivate Insurerspremiumstaxesdirect/out-of-pocket paymentsMedicare, Medicaid, SCHIP, VA, IHSpayments to providerspublic employees’ premiumssubsidies
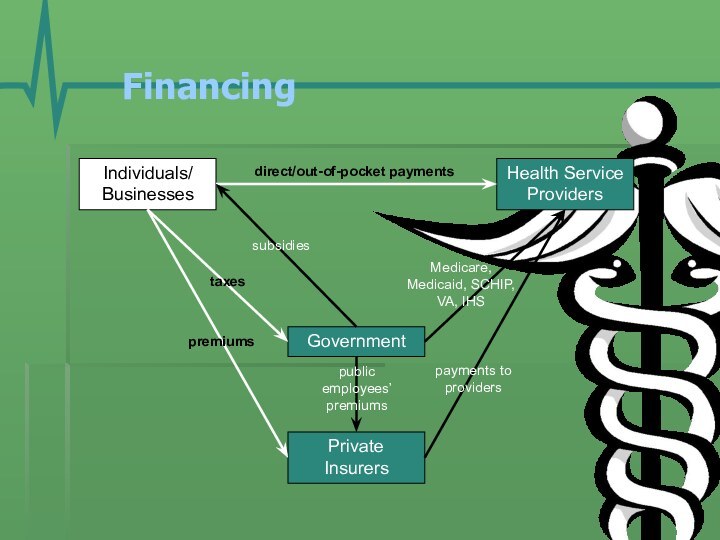
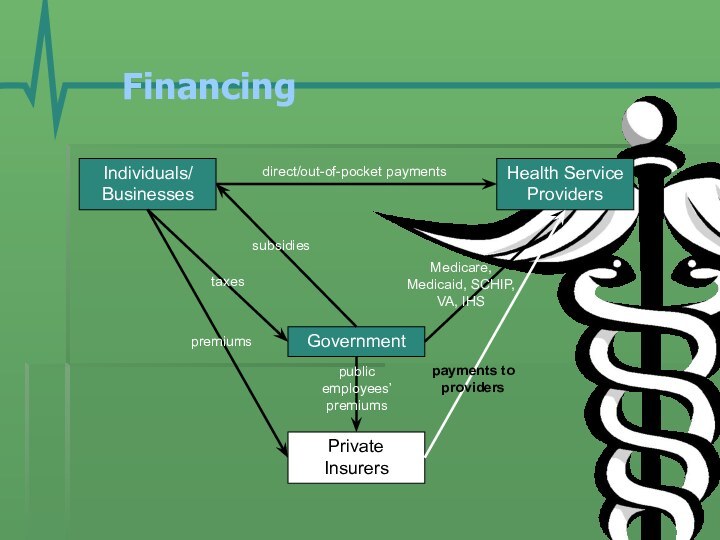
- 12. Financing Individuals/BusinessesGovernmentHealth Service ProvidersPrivate Insurerspremiumstaxesdirect/out-of-pocket paymentsMedicare, Medicaid, SCHIP, VA, IHSpayments to providerspublic employees’ premiumssubsidies
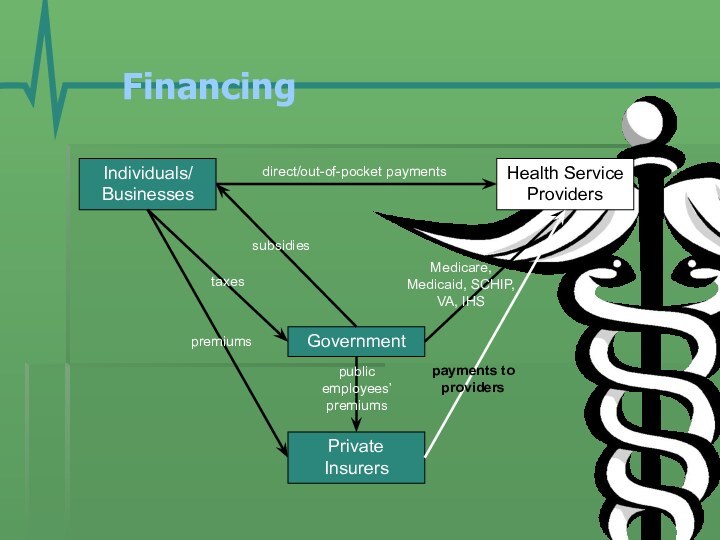
- 13. Financing Individuals/BusinessesGovernmentHealth Service ProvidersPrivate Insurerspremiumstaxesdirect/out-of-pocket paymentsMedicare, Medicaid, SCHIP, VA, IHSpayments to providerspublic employees’ premiumssubsidies
- 14. Financing Individuals/BusinessesGovernmentHealth Service ProvidersPrivate Insurerspremiumstaxesdirect/out-of-pocket paymentsMedicare, Medicaid, SCHIP, VA, IHSpayments to providerspublic employees’ premiumssubsidies
- 15. Financing Individuals/BusinessesGovernmentHealth Service ProvidersPrivate Insurerspremiumstaxesdirect/out-of-pocket paymentsMedicare, Medicaid, SCHIP, VA, IHSpayments to providerspublic employees’ premiumssubsidies
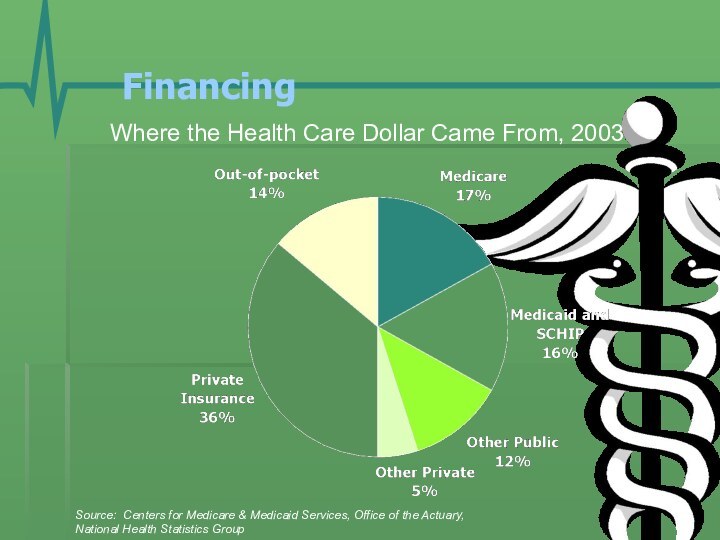
- 16. Financing Where the Health Care Dollar Came
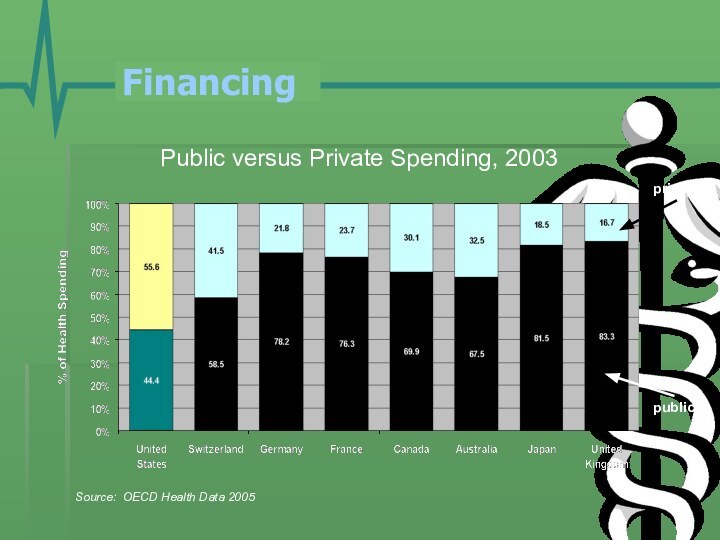
- 17. Financing Public versus Private Spending, 2003Source: OECD Health Data 2005publicprivate
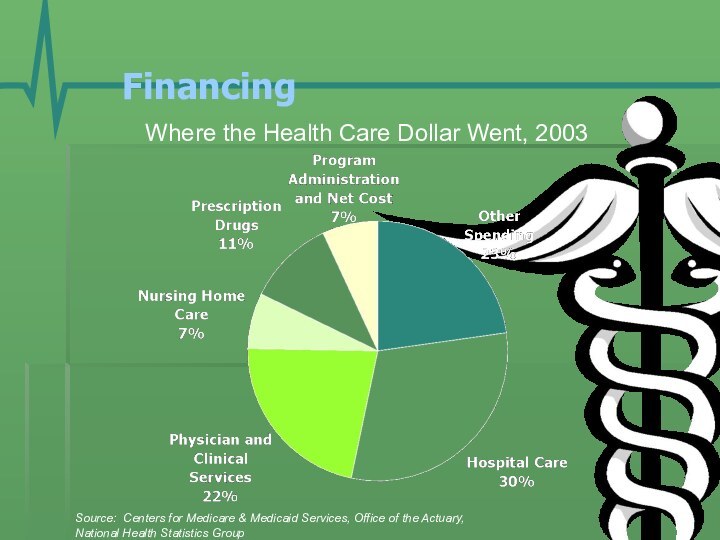
- 18. Financing Where the Health Care Dollar Went,
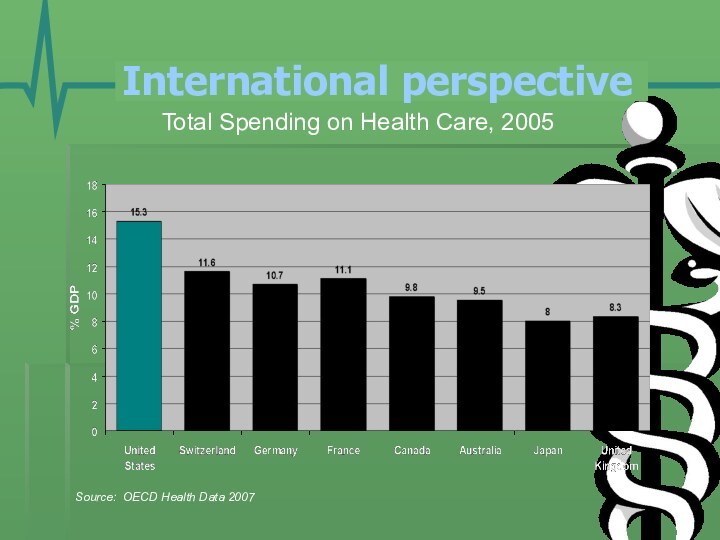
- 19. Total Spending on Health Care, 2005Source: OECD Health Data 2007International perspective
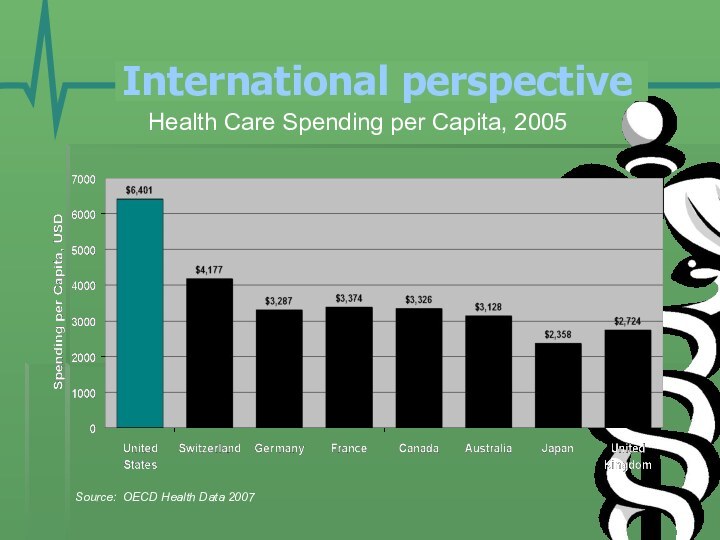
- 20. Health Care Spending per Capita, 2005Source: OECD Health Data 2007International perspective
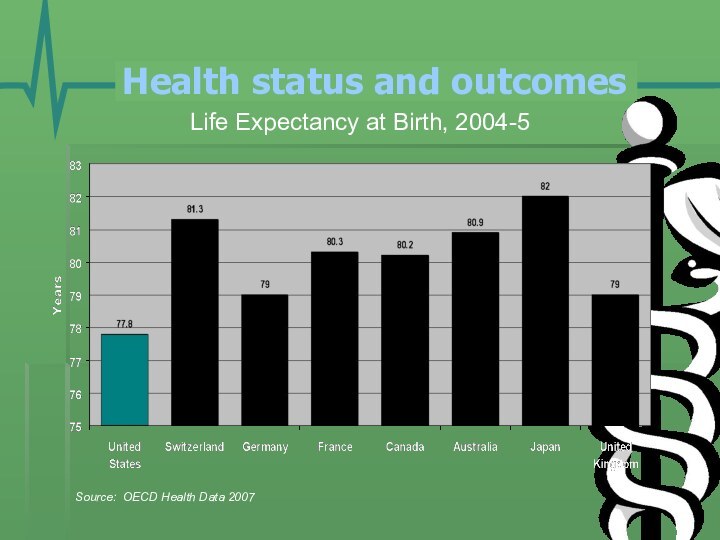
- 21. Health status and outcomes Life Expectancy at Birth, 2004-5Source: OECD Health Data 2007
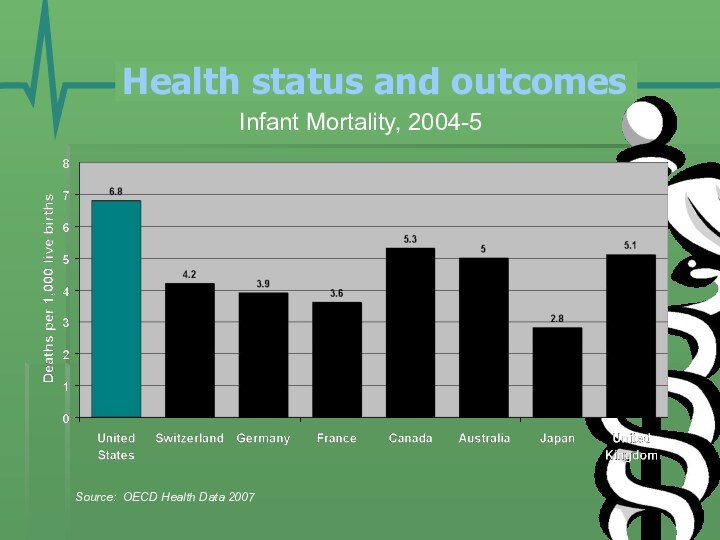
- 22. Health status and outcomes Infant Mortality, 2004-5Source: OECD Health Data 2007
- 23. Скачать презентацию
- 24. Похожие презентации
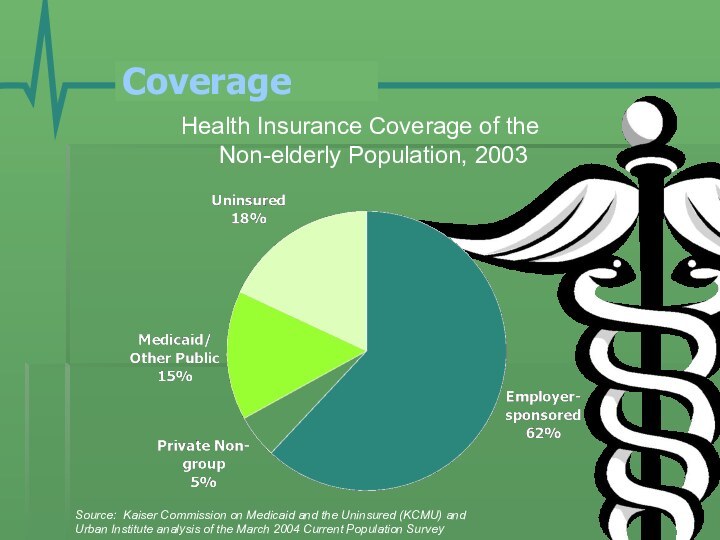
CoverageHealth Insurance Coverage of the Non-elderly Population, 2003Source: Kaiser Commission on Medicaid and the Uninsured (KCMU) and Urban Institute analysis of the March 2004 Current Population Survey
Слайд 3
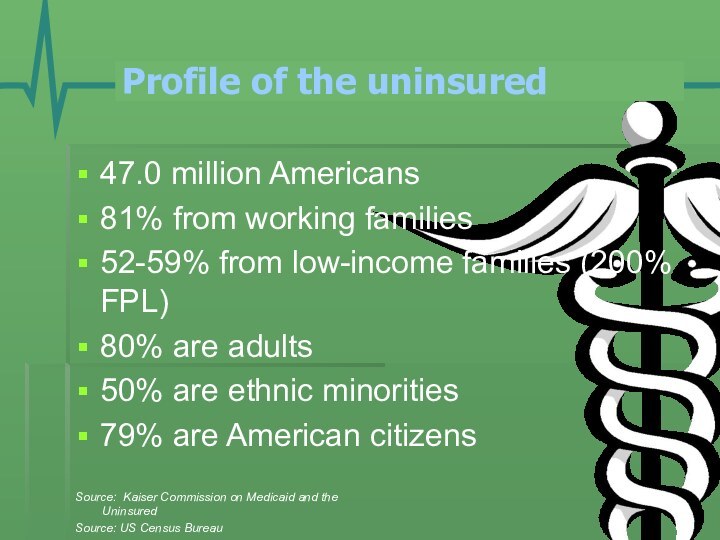
Profile of the uninsured
47.0 million Americans
81% from working
families
52-59% from low-income families (200% FPL)
80% are adults
50% are
ethnic minorities79% are American citizens
Source: Kaiser Commission on Medicaid and the Uninsured
Source: US Census Bureau
Слайд 4
Employer-sponsored insurance
Offered by employers as part of benefits
package
Administered by private insurance companies (for-profit and non-profit)
Employer pays
bulk of premium; employee pays remainderSignificant erosion of employer-sponsored insurance in recent years
Слайд 5
Individual insurance
Purchased directly by people who do not
get coverage through their employers
Non-group (individual) plans
Premiums based on
individual health riskHigh-risk individuals with limited access
Administratively expensive
Слайд 6
Medicare
Covers elderly (ages 65 and older) and non-elderly
with disabilities
Administered by the federal government (essentially a single-payer
system)Financed through:
Federal income taxes
Payroll taxes
Out-of-pocket payments by enrollees
Слайд 7
Medicare
Four parts:
Part A – hospital insurance
Part B
– supplemental insurance
Part C – managed care
Part D –
prescription drugsSignificant coverage gaps - most enrollees obtain supplemental insurance
Spending growth generally slower than private insurance
Aging population and increased technology presents challenges for the future
Слайд 8
Medicaid
Covers certain low-income individuals; not every poor person
is covered!
Administered by state governments
Often out-sourced to non-government administrators
Financed
jointly by the state and federal governmentsBenefits are fairly comprehensive, but many providers won’t take care of Medicaid patients
Слайд 9
State Children’s Health Insurance Program (S-CHIP)
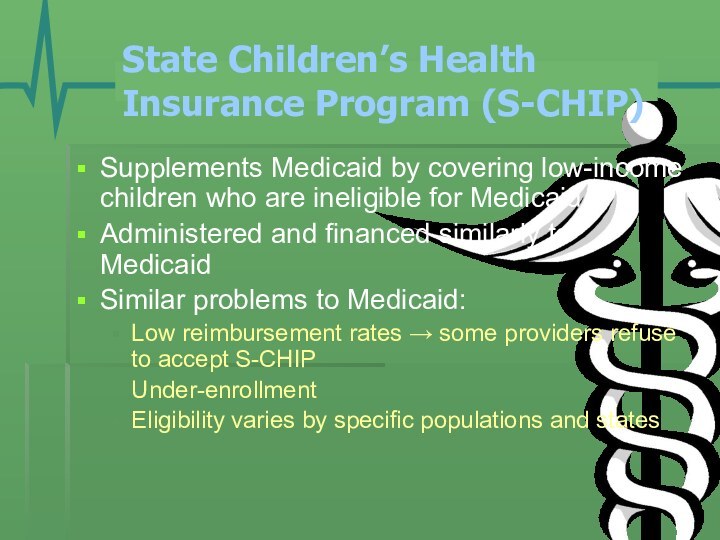
Supplements Medicaid by
covering low-income children who are ineligible for Medicaid
Administered and
financed similarly to MedicaidSimilar problems to Medicaid:
Low reimbursement rates → some providers refuse to accept S-CHIP
Under-enrollment
Eligibility varies by specific populations and states
Слайд 10
Other public insurance programs
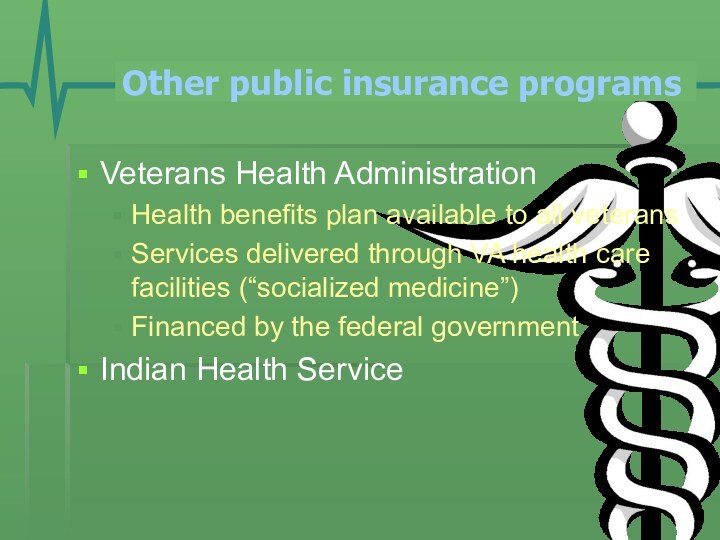
Veterans Health Administration
Health benefits
plan available to all veterans
Services delivered through VA
health care facilities (“socialized medicine”)Financed by the federal government
Indian Health Service


