Слайд 2
Main theme
The United States is now in the
midst of a massive immigration that has been changing
the nation --- something that also happened a hundred years ago. In my talk this evening, I want to explore some basic questions that put the current immigration to the US in historical perspective.
Two main questions:
(1) Is history repeating itself ? In some ways, the answer is yes. There are many parallels with the past.
(2) But we are not just witnessing a timeless immigrant saga. In many ways, today’s immigration to the U.S. differs profoundly from the past. What is new about U.S. immigration and the immigrant experience today?
Слайд 3
Why is a historical comparison of “then and
now” important?
There’s a popular tendency in the United
States to look back with nostalgia to immigrants in a so-called golden age of immigration -- to romanticize or glorify the experience of immigrants in the past. And to see immigrants today as overwhelmingly different – and inferior. A historical comparison makes clear that this is wrong.
A comparison of past and present helps us appreciate what is unique about each immigration era and what is more general to the American migration experience.
Слайд 4
Why is a historical comparison of “then and
now” important?
By acquainting us with what has gone on
before, a comparative approach can inspire a critical awareness of what is taken for granted in our own time.
Viewing today’s immigration in light of the past is valuable for immigrants in the U.S. today – because it brings out that immigrants before have also struggled and experienced difficulties when they came to the US.
Слайд 5
Focus of the Talk: Two Great Immigration Waves
of the Past 125 Years
Last great wave to the
US: between 1880s and early 1920s
Present wave to the US: began in the late 1960s and still going strong
Слайд 7
Six Parallels with the Past
First:
The United States
is not experiencing large-scale immigration for the first time.
Early
twentieth century America was as much an immigrant country as it is today.
Слайд 8
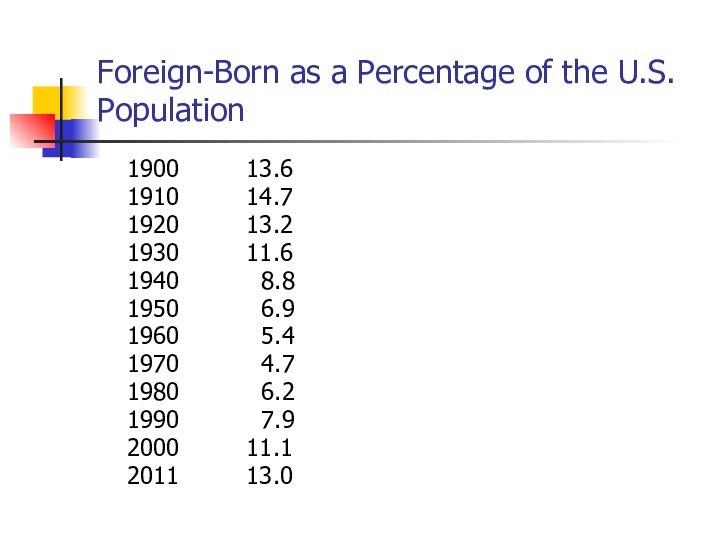
Foreign-Born as a Percentage of the U.S. Population
1900 13.6
1910
14.7
1920 13.2
1930 11.6
1940 8.8
1950 6.9
1960 5.4
1970 4.7
1980 6.2
1990 7.9
2000 11.1
2011 13.0
Слайд 9
Second: Work and Immigrants’ Place in the U.S.
Economy
Because many immigrants today arrive with low skill levels,
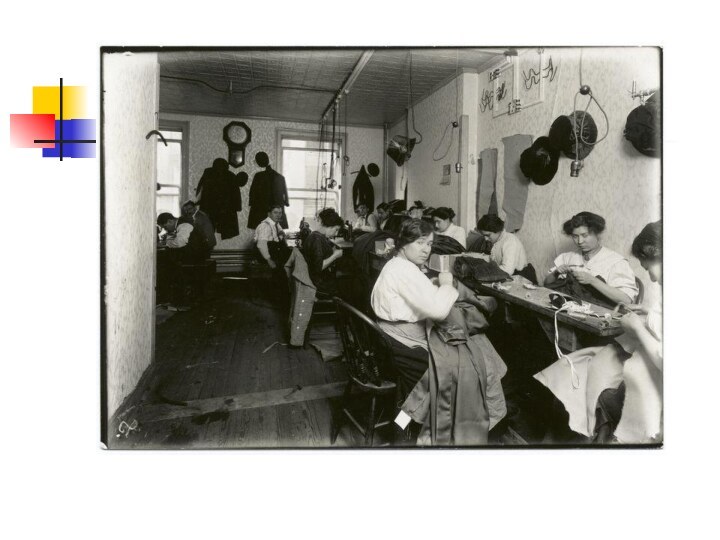
do not know English, and are new to the United States, they, like their predecessors a hundred years ago, often enter the economy at the bottom: taking low-paid jobs with long hours and unpleasant working conditions that nobody else wants.
Italians in the past dug ditches and tunnels; today many Mexicans work in construction (and even more did before the recession!). Some of the jobs are even the same -- working in garment sweatshops, for example, taking care of the gardens and children of the well-to-do
Слайд 11
Third: Where Immigrants Live
Many newcomers to the U.S.
today, like those a century ago, cluster in ethnic
residential enclaves, often sharing homes or apartment buildings with people from their home communities and giving many neighborhoods a distinct ethnic flavor. Reasons: choice and constraint
Also: their low incomes – and recent entry into the housing market – force many immigrant families today, as in the past, into crowded and sometimes substandard living quarters and to rent out space to their compatriots in order to make ends meet.
Слайд 12
Fourth: The question of race in the U.S.
It
is often said that a major distinction between today’s
immigrants and those a hundred years ago is that then they were white Europeans – and today most are people of color.
But southern and eastern European immigrants a century ago were not viewed as white in the same way that people with origins in northern and western Europe were.
They were seen as inferior whites – as “probationary whites”(Jacobson), “in-between peoples” (Barrett and Roediger), or “color insiders” but “racial outsiders” (Guglielmo)
Слайд 13
The question of race
A hundred years ago, a
common belief was that southern Italian and eastern European
Jewish immigrants belonged to inferior “mongrel” races that were polluting the nation’s Anglo-Saxon or Nordic stock.
Then Vice-President Calvin Coolidge: “America must be kept American. Biological laws show that Nordics deteriorate when mixed with other races.”
Madison Grant (patrician founder of the NY Zoological Society): “America is being swept toward a racial abyss… the type of American of colonial descent will become extinct.”
Слайд 14
The question of race
Jewish and Italian immigrants were
believed to have distinct biological features, mental abilities, and
innate character traits. They looked different to most Americans, and were thought to have certain physical features that set them apart – facial features often noted, for example, in the case of Jews, and “swarthy” skin, in the case of Italians.
To refute the stereotype, Dr. Maurice Fishberg, a professor of medicine at New York University and a Russian Jewish immigrant himself, classified the noses of nearly 3000 Jewish men in New York City, finding that “only 14 percent had the aquiline or hooked nose commonly labeled as a ‘Jewish’ nose.”
Слайд 15
Fifth: Transnational Ties
Transnationalism, or maintaining political, social, economic,
and cultural ties to the home country, is not
a new invention.
Many immigrants to the U.S. in the last great wave of immigration maintained extensive transnational ties: they sent money (and letters) to relatives back home and put away money to buy land and houses in the home country.
Слайд 16
Transnational Ties
Large numbers of Italians (“birds of passage”)
engaged in circular migration – going back to their
home village seasonally or every few years, and many immigrants, in a variety of groups, remained actively involved in the politics of the homeland.
Some homeland governments – Italy being a prime example – were also involved with their citizens in the US, subsidizing organizations to help them, for example, and facilitating the flow of remittances homeward.
Слайд 17
Sixth: Learning English
A common fear is that today’s
immigrants and their children are not learning English –
and that this is different from the past.
But when it comes to language, the similarities with the past stand out– and the fears that immigrants and their children today will not learn English are unfounded.
Слайд 18
Learning English
The standard three-generation model of linguistic assimilation
still holds:
the immigrant generation (arriving as adults) makes
progress but is usually more comfortable and fluent in the native tongue;
the second generation tends to be bilingual but speaks English fluently;
and the third generation is, overwhelmingly, monolingual in English.
Слайд 19
Learning English
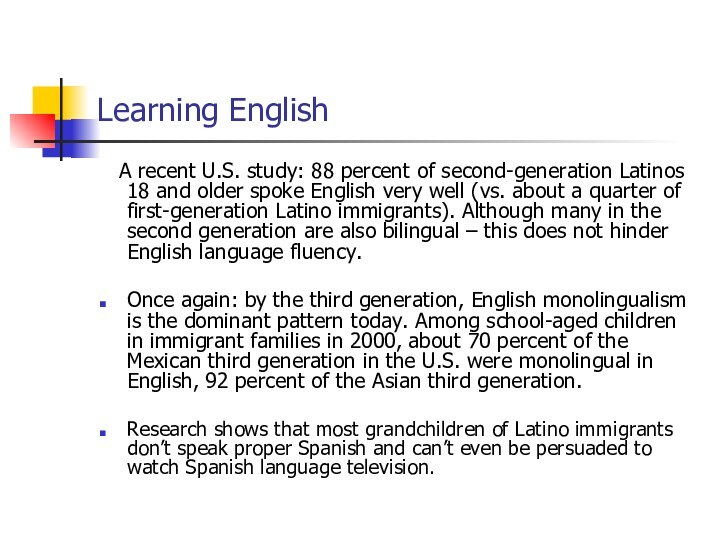
A recent U.S. study: 88
percent of second-generation Latinos 18 and older spoke English
very well (vs. about a quarter of first-generation Latino immigrants). Although many in the second generation are also bilingual – this does not hinder English language fluency.
Once again: by the third generation, English monolingualism is the dominant pattern today. Among school-aged children in immigrant families in 2000, about 70 percent of the Mexican third generation in the U.S. were monolingual in English, 92 percent of the Asian third generation.
Research shows that most grandchildren of Latino immigrants don’t speak proper Spanish and can’t even be persuaded to watch Spanish language television.
Слайд 20
The other part of the story: seven new
aspects of immigration today
There are many contrasts between then
and now – and they stand out because the immigrants coming to the U.S. today are different, because the United States is a different place – indeed, the world is a different place!!
Much, in short, is new about the U.S. immigration story today.
Слайд 21
First: Who the immigrants are, or the nature
of immigrant flows
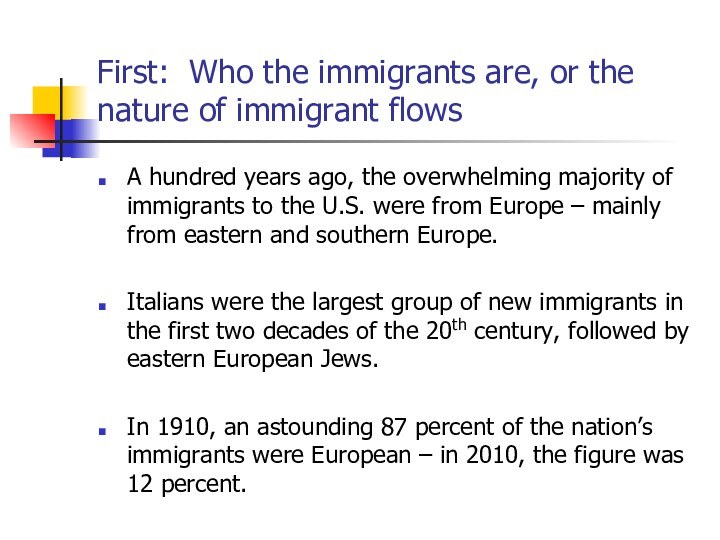
A hundred years ago, the overwhelming majority
of immigrants to the U.S. were from Europe – mainly from eastern and southern Europe.
Italians were the largest group of new immigrants in the first two decades of the 20th century, followed by eastern European Jews.
In 1910, an astounding 87 percent of the nation’s immigrants were European – in 2010, the figure was 12 percent.
Слайд 22
Regions of Origin
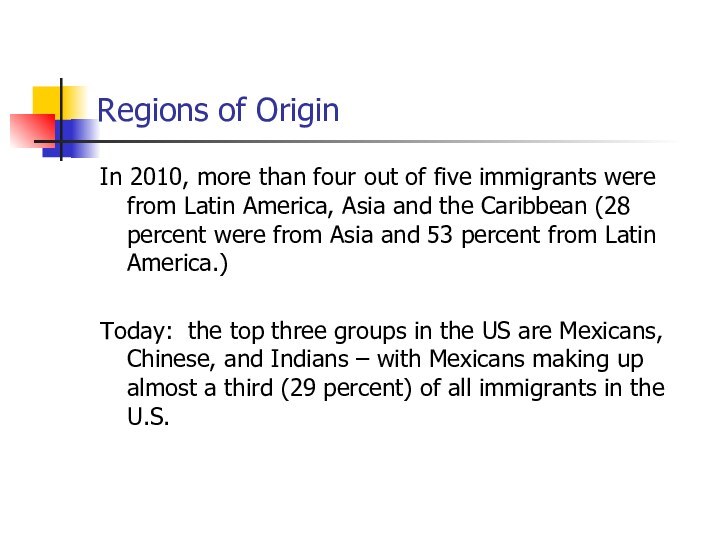
In 2010, more than four out
of five immigrants were from Latin America, Asia and
the Caribbean (28 percent were from Asia and 53 percent from Latin America.)
Today: the top three groups in the US are Mexicans, Chinese, and Indians – with Mexicans making up almost a third (29 percent) of all immigrants in the U.S.
Слайд 23
Top Ten Source Countries of U.S. Foreign Born,
2010 (thousands)
Number Percent of Immigrant Population
Mexico 11, 711 29
China 2, 166 5
India 1, 780 4
Philippines 1, 778 4
Vietnam 1, 241 3
El Salvador 1, 214 3
Cuba 1, 105 3
South Korea 1, 100 3
Dom. Rep. 880 2
Guatemala 831 2
Слайд 24
Numbers Today
Immigrants today may be a lower percentage
of the U.S. population than in 1910 but there
are many more of them today.
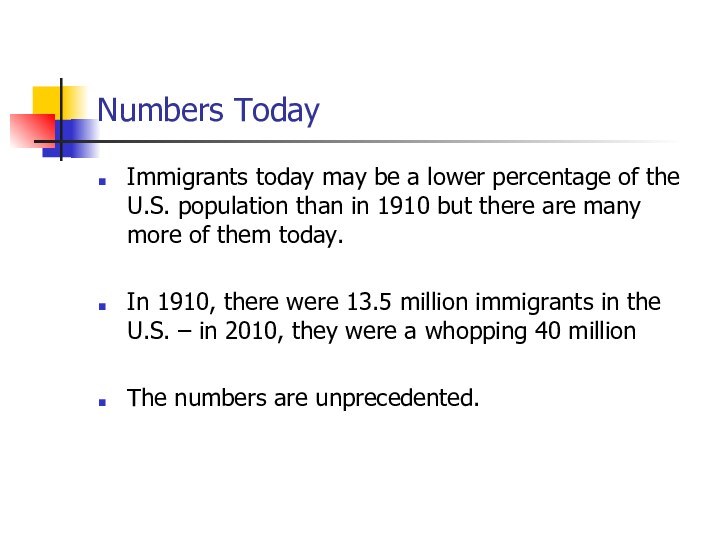
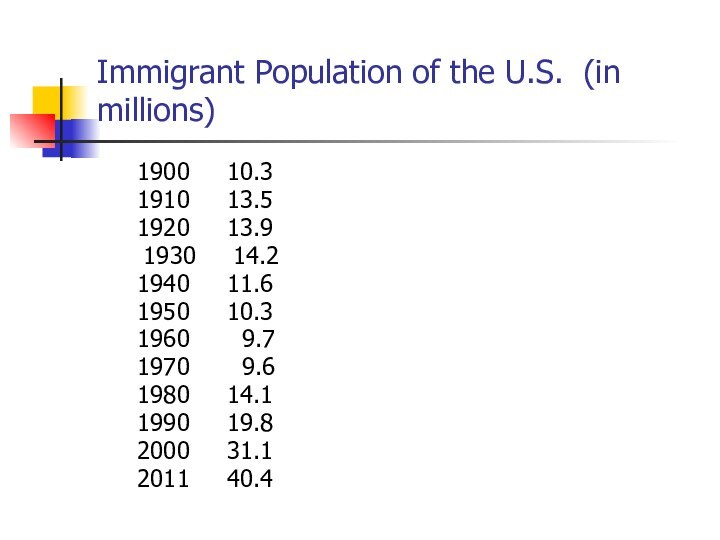
In 1910, there were 13.5 million immigrants in the U.S. – in 2010, they were a whopping 40 million
The numbers are unprecedented.
Слайд 25
Immigrant Population of the U.S. (in millions)
1900 10.3
1910
13.5
1920 13.9
1930 14.2
1940 11.6
1950 10.3
1960 9.7
1970 9.6
1980 14.1
1990 19.8
2000 31.1
2011 40.4
Слайд 26
Second: Undocumented Immigrants
A hundred years ago, there
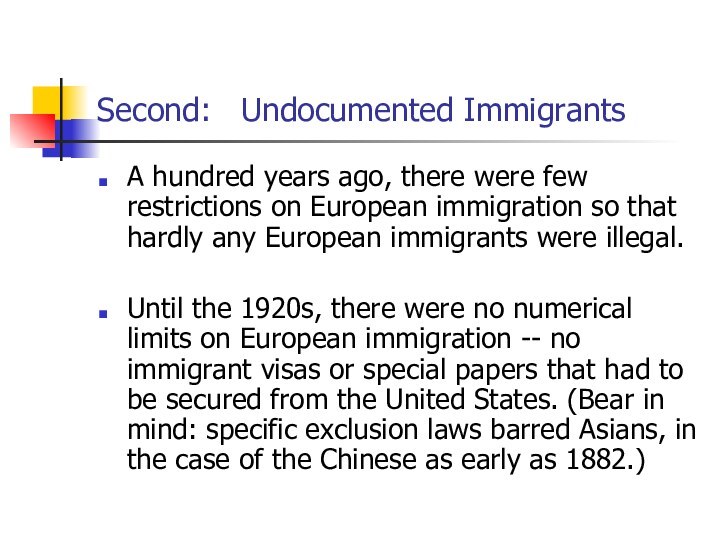
were few restrictions on European immigration so that hardly
any European immigrants were illegal.
Until the 1920s, there were no numerical limits on European immigration -- no immigrant visas or special papers that had to be secured from the United States. (Bear in mind: specific exclusion laws barred Asians, in the case of the Chinese as early as 1882.)
Слайд 27
Undocumented immigrants
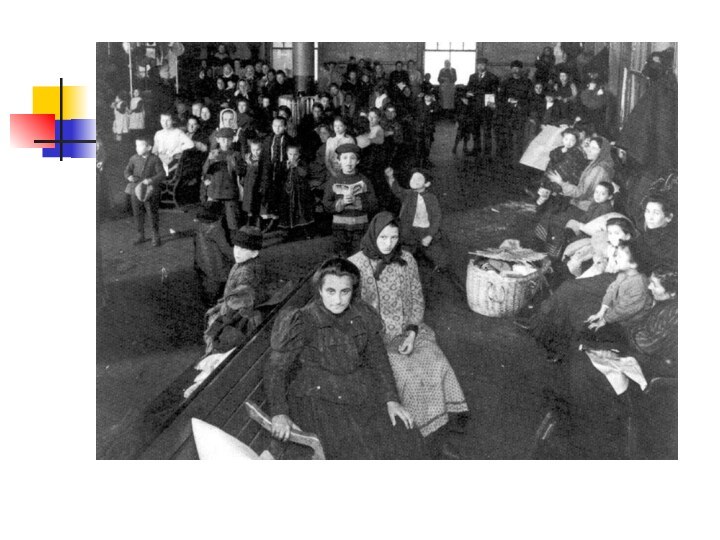
European immigrants came by boat
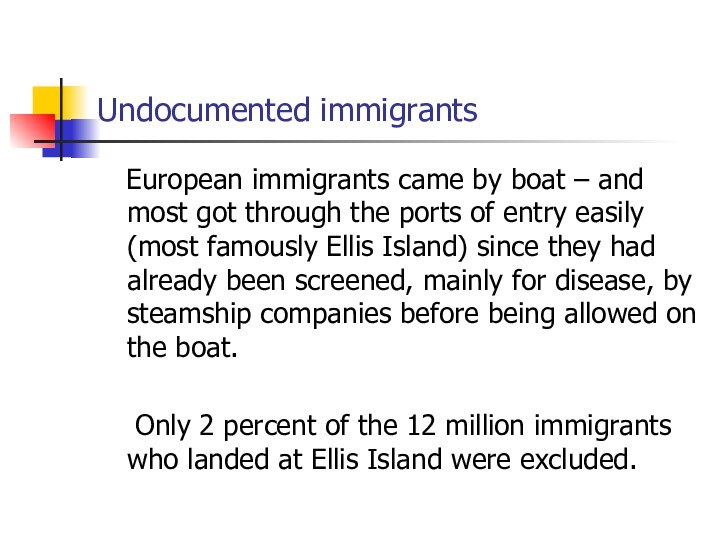
– and most got through the ports of entry
easily (most famously Ellis Island) since they had already been screened, mainly for disease, by steamship companies before being allowed on the boat.
Only 2 percent of the 12 million immigrants who landed at Ellis Island were excluded.
Слайд 29
Differences Today
Today, if you don’t have authorization by
US authorities, you can’t legally live and work in
the US
There are numerical limits on the number of immigrant visas– and in many countries, a long wait to get them, even if you have a family member to sponsor you. (Most immigrants are legally admitted to the US under family reunification provisions of US immigration law).
Слайд 30
Undocumented immigrants
In 2012, a US citizen wanting to
sponsor an unmarried adult child from Mexico had to
wait about 20 years before the application would be processed.
Legal permanent residents applying to bring their immediate family members (spouses and minor children) could expect to wait about three years, regardless of country of origin.
The result: many arrive or remain without proper documents. The latest estimate: 11.5 million undocumented immigrants in the US in 2011 , 59 percent from Mexico, another 11 percent from El Salvador and Guatemala.
Слайд 31
Third: Social and Economic Backgrounds of Immigrants
Remarkable diversity
of backgrounds today.
Many of today’s immigrants are still poorly
educated and low-skilled --- 32 percent of the foreign born 25 and older in 2011 in the United States lacked a high school diploma -- but substantial numbers now come with college degrees or more.
In 2011, 27 percent of the foreign born 25 and older in the United States were college graduates.
Never in the history of U.S. immigration has such a high proportion arrived with such high educational qualifications.
Слайд 32
Fourth: Where Immigrants Live
A hundred years ago, most
European immigrants went to the Northeast and Midwest –
in 1920, this is where 80 percent of the nation’s immigrants lived.
Today: large numbers also go to the Southwest, West, and South – most notably, California, Texas and Florida.
In 2011: California had the nation’s largest immigrant population (10.2 million), followed by New York (4.3 million), Texas (4.2 million), Florida (3.7 million), New Jersey (1.9 million)
Слайд 34
Fifth: Jobs and the Economy
Given that a substantial
minority of today’s immigrants have college degrees – and
some bring substantial amounts of financial capital – it is not surprising that many arrive ready and able to find decent, often high-level jobs in the mainstream economy. This is another difference from the past.
Also, in the postindustrial, service economy, fewer immigrants work in factories, more in the service sector than in the past.
Слайд 35
Jobs and the Economy
Legal status wasn’t an issue
for European immigrants a hundred years ago – it
is for many immigrants today.
Having a green card (permanent resident legal status) is not a recipe for success, but without it an immigrant has more trouble getting a good job and making a living wage in the formal economy – and this has enormous ramifications for their own lives and for their children’s lives as well.
Слайд 36
Sixth: What’s New About Transnationalism
Transnationalism may not be
a new invention, but much is new about transnationalism
today.
With modern technology and communications, immigrants can maintain more frequent, immediate, and closer contact with their home societies than before.
Слайд 37
Transnationalism Today
A century ago it took two weeks
to get back to Italy; today, immigrants can hop
on a plane. Or pick up the phone to make a call to hear news from relatives – and be involved in everyday life in the home community in a fundamentally different way than in the past. With prepaid phone cards, telephoning is cheap. And there are new types of communication such as email, text messages, and Skype.
The case of Jamaica
A growing number of countries of origin allow dual citizenship – many immigrants can vote in home-country elections even after becoming American citizens, and a growing number, like Colombians in New York, are able to do this from the US.
Слайд 38
Seventh: Continuing Immigration
In the past, there was a
halt in mass immigration to the US from southern
and eastern Europe in the 1920s as a result of legislative restrictions followed by the Great Depression and World War II – and mass inflows did not begin again until the 1960s.
The second generation growing up in the 1930s, 1940s and 1950s did so in a context in which there were hardly any newly-arrived immigrants in their communities.
This is different from today when immigration to the US has been continuing at high rates – and a halt in mass inflows, like that in the past, is unlikely.
Слайд 39
Continuing Immigration
In 2011: 27 percent of immigrants in
the US came between 1990 and 1999, 36 percent
since 2000 – a total of 63 percent!
Many children of immigrants today grow up in communities where newcomers (of all ages) – who have strong ties to the home country, customs, and languages -- are arriving every day.
Слайд 40
Conclusion
As we look at immigration in 21st century
America, it is helpful to view it with a
historical sensibility – to try and appreciate what is genuinely new about contemporary immigration as well as the ways that we’ve been there before.
As the historian David Kennedy has written: “The only way we can know with certainty as we move along time’s path that we have come to a new place is to know something of where we have been.”
Слайд 41
Conclusion
Comparing immigration today and in the past dispels
myths about heroes and heroines from a glorious golden
age of immigration in the past.
And it reminds present-day immigrants of what they have in common with their predecessors – which can give them a greater sense of being part of America as a “nation of immigrants” and perhaps also hope for the future.
Слайд 42
Conclusion
As a leader of an immigrant federation in
Brooklyn put it a few years ago in the
New York Times: “We look at the Italian community, the Jewish community. They started out like us or even worse off… Eventually the day will come for us.”
