Слайд 2
13.1 Can Financing Decisions Create Value?
Earlier parts of
the book show how to evaluate investment projects according
to NPV criterion.
The next five chapters concern financing decisions.
Слайд 3
What Sort of Financing Decisions?
Typical financing decisions include:
How
much debt and equity to sell
When (or if) to
pay dividends
When to sell debt and equity
Just as we can use NPV criteria to evaluate investment decisions, we can use NPV to evaluate financing decisions.
Слайд 4
How to Create Value through Financing
Fool Investors
Empirical evidence
suggests that it is hard to fool investors consistently.
Reduce
Costs or Increase Subsidies
Certain forms of financing have tax advantages or carry other subsidies.
Create a New Security
Sometimes a firm can find a previously-unsatisfied clientele and issue new securities at favourable prices.
In the long-run, this value creation is relatively small, however.
Слайд 5
13.2 A Description of Efficient Capital Markets
An efficient
capital market is one in which stock prices fully
reflect available information.
The EMH has implications for investors and firms.
Since information is reflected in security prices quickly, knowing information when it is released does an investor no good.
Firms should expect to receive the fair value for securities that they sell. Firms cannot profit from fooling investors in an efficient market.
Слайд 6
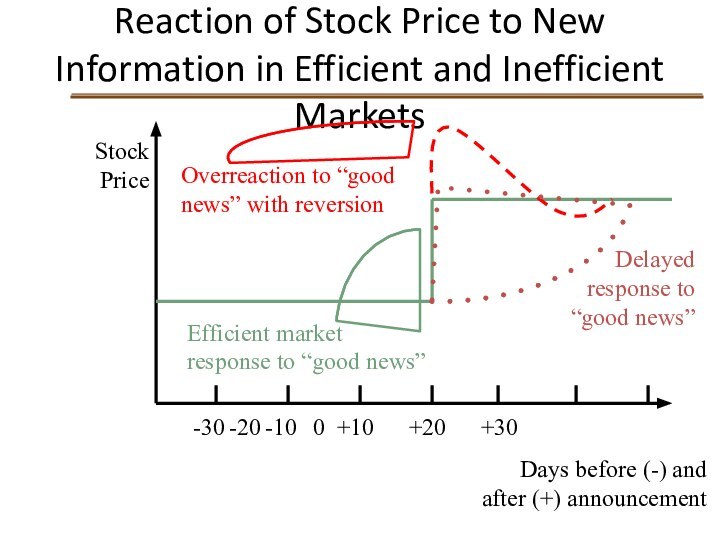
Reaction of Stock Price to New Information in
Efficient and Inefficient Markets
Stock Price
-30 -20 -10 0 +10 +20 +30
Days before (-) and
after (+) announcement
Efficient market response to “good news”
Overreaction to “good news” with reversion
Delayed response to “good news”
Слайд 7
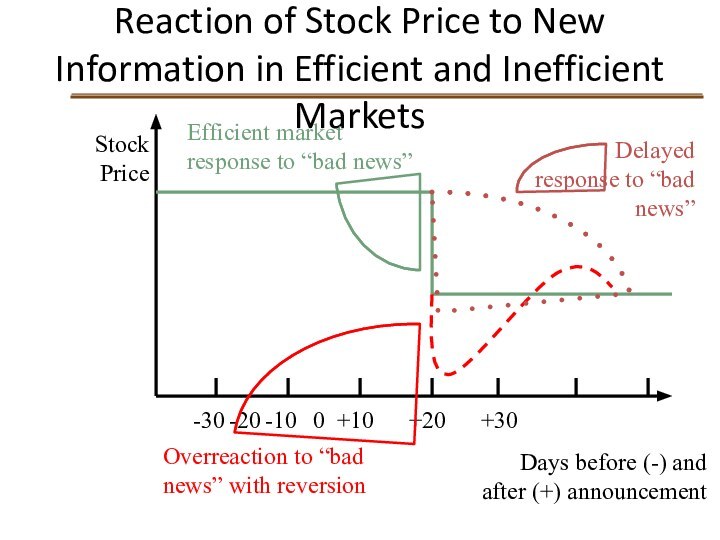
Reaction of Stock Price to New Information in
Efficient and Inefficient Markets
Stock Price
-30 -20 -10 0 +10 +20 +30
Days before (-) and
after (+) announcement
Efficient market response to “bad news”
Overreaction to “bad news” with reversion
Delayed response to “bad news”
Слайд 8
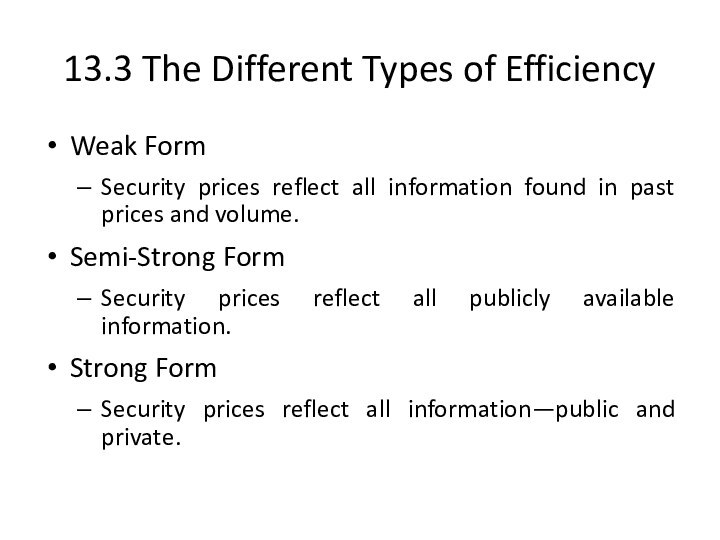
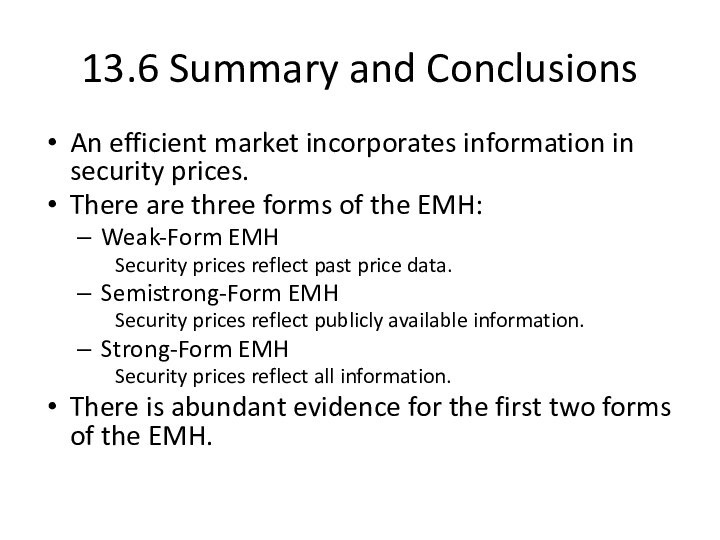
13.3 The Different Types of Efficiency
Weak Form
Security prices
reflect all information found in past prices and volume.
Semi-Strong
Form
Security prices reflect all publicly available information.
Strong Form
Security prices reflect all information—public and private.
Слайд 9
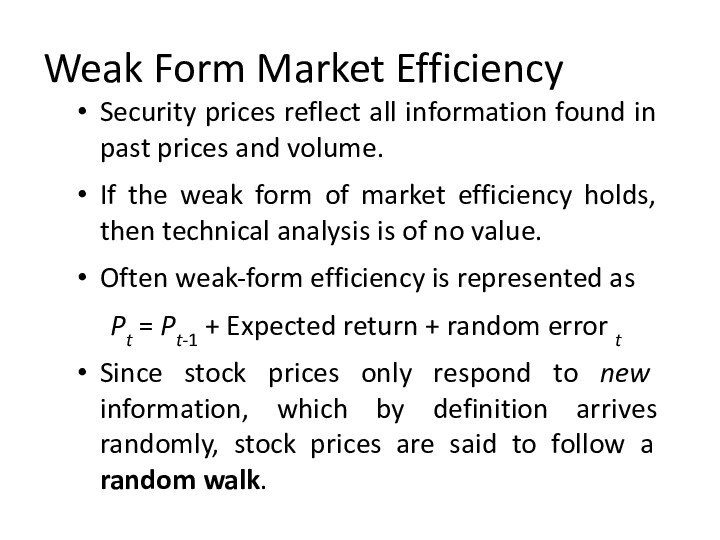
Weak Form Market Efficiency
Security prices reflect all information
found in past prices and volume.
If the weak form
of market efficiency holds, then technical analysis is of no value.
Often weak-form efficiency is represented as
Pt = Pt-1 + Expected return + random error t
Since stock prices only respond to new information, which by definition arrives randomly, stock prices are said to follow a random walk.
Слайд 10
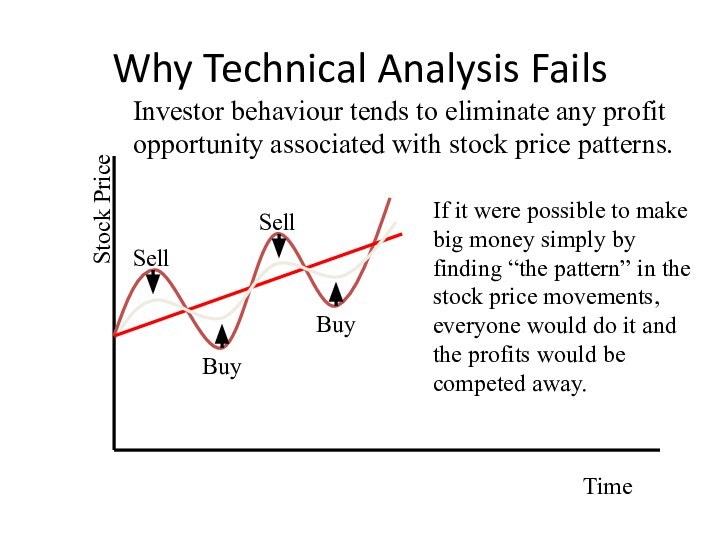
Why Technical Analysis Fails
Stock Price
Time
Investor behaviour tends to
eliminate any profit opportunity associated with stock price patterns.
If
it were possible to make big money simply by finding “the pattern” in the stock price movements, everyone would do it and the profits would be competed away.
Слайд 11
Semi-Strong Form Market Efficiency
Security prices reflect all publicly
available information.
Publicly available information includes:
Historical price and volume information
Published
accounting statements.
Information found in annual reports.
Слайд 12
Strong Form Market Efficiency
Security prices reflect all information—public
and private.
Strong form efficiency incorporates weak and semi-strong form
efficiency.
Strong form efficiency says that anything pertinent to the stock and known to at least one investor is already incorporated into the security’s price.
Слайд 13
Relationship among Three Different Information Sets
Слайд 14
Some Common Misconceptions
Much of the criticism of the
EMH has been based on a misunderstanding of what
the hypothesis says and does not say.
Слайд 15
What the EMH Does and Does NOT Say
Investors
can throw darts to select stocks.
This is almost, but
not quite, true.
An investor must still decide how risky a portfolio he wants based on risk aversion and the level of expected return.
Prices are random or uncaused.
Prices reflect information.
The price CHANGE is driven by new information, which by definition arrives randomly.
Therefore, financial managers cannot “time” stock and bond sales.
Слайд 16
13.4 The Evidence
The record on the EMH is
extensive, and in large measure it is reassuring to
advocates of the efficiency of markets.
Studies fall into three broad categories:
Are changes in stock prices random? Are there profitable “trading rules”?
Event studies: does the market quickly and accurately respond to new information?
The record of professionally managed investment firms.
Слайд 17
Are Changes in Stock Prices Random?
Can we really
tell?
Many psychologists and statisticians believe that most people want
to see patterns even when faced with pure randomness.
People claiming to see patterns in stock price movements are probably seeing optical illusions.
A matter of degree
Even if we can spot patterns, we need to have returns that beat our transactions costs.
Random stock price changes support weak-form efficiency.
Слайд 18
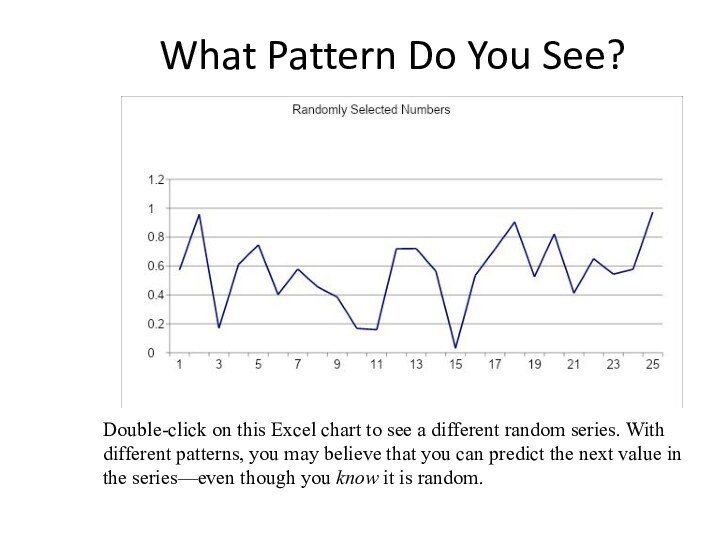
What Pattern Do You See?
Double-click on this Excel
chart to see a different random series. With different
patterns, you may believe that you can predict the next value in the series—even though you know it is random.
Слайд 19
Event Studies: How Tests Are Structured
Event studies are
one type of test of the semi-strong form of
market efficiency.
This form of the EMH implies that prices should reflect all publicly available information.
To test this, event studies examine prices and returns over time—particularly around the arrival of new information.
Test for evidence of underreaction, overreaction, early reaction, delayed reaction around the event.
Слайд 20
How Tests Are Structured (cont.)
Returns are adjusted to
determine if they are abnormal by taking into account
what the rest of the market did that day.
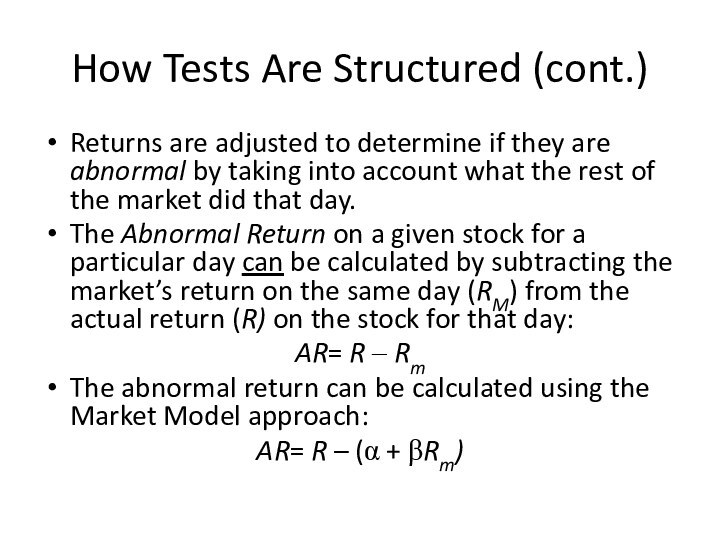
The Abnormal Return on a given stock for a particular day can be calculated by subtracting the market’s return on the same day (RM) from the actual return (R) on the stock for that day:
AR= R – Rm
The abnormal return can be calculated using the Market Model approach:
AR= R – (α + βRm)
Слайд 21
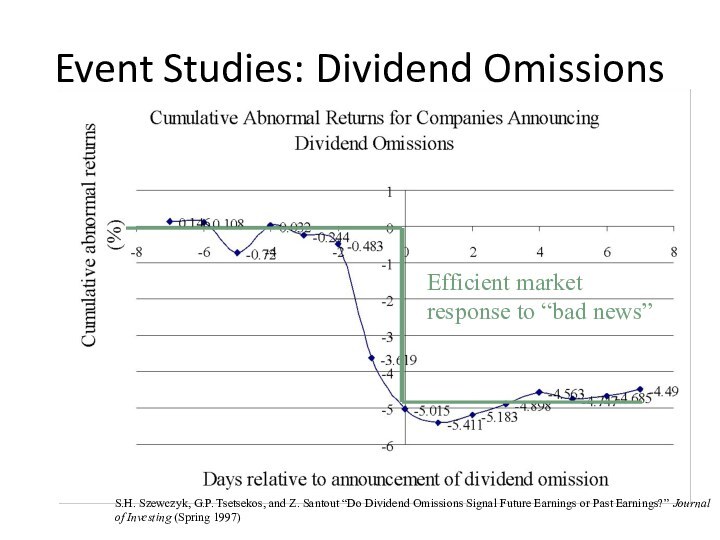
Event Studies: Dividend Omissions
Efficient market response to “bad
news”
S.H. Szewczyk, G.P. Tsetsekos, and Z. Santout “Do Dividend
Omissions Signal Future Earnings or Past Earnings?” Journal of Investing (Spring 1997)
Слайд 22
Event Study Results
Over the years, event study methodology
has been applied to a large number of events
including:
Dividend increases and decreases
Earnings announcements
Mergers
Capital spending
New issues of stock
The studies generally support the view that the market is semistrong-form efficient.
In fact, the studies suggest that markets may even have some foresight into the future—in other words, news tends to leak out in advance of public announcements.
Слайд 23
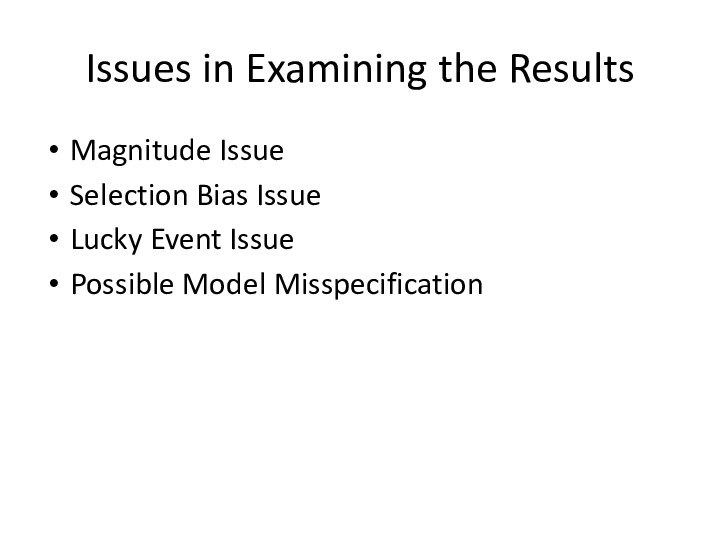
Issues in Examining the Results
Magnitude Issue
Selection Bias Issue
Lucky
Event Issue
Possible Model Misspecification
Слайд 24
The Record of Mutual Funds
If the market is
semistrong-form efficient, then no matter what publicly available information
mutual-fund managers rely on to pick stocks, their average returns should be the same as those of the average investor in the market as a whole.
We can test efficiency by comparing the performance of professionally managed mutual funds with the performance of a market index.
Слайд 25
The Record of Mutual Funds
Taken from Lubos Pastor
and Robert F. Stambaugh, “Evaluating and Investing in Equity
Mutual Funds,” unpublished paper, Graduate School of Business, University of Chicago (March 2000).
Слайд 26
The Strong Form of the EMH
One group of
studies of strong-form market efficiency investigates insider trading.
A number
of studies support the view that insider trading is abnormally profitable.
Thus, strong-form efficiency does not seem to be substantiated by the evidence.
Слайд 27
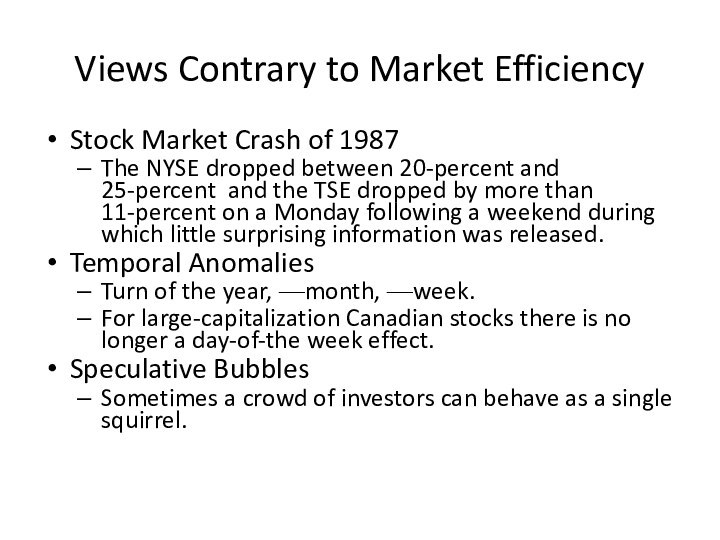
Views Contrary to Market Efficiency
Stock Market Crash of
1987
The NYSE dropped between 20-percent and 25-percent and the
TSE dropped by more than 11-percent on a Monday following a weekend during which little surprising information was released.
Temporal Anomalies
Turn of the year, —month, —week.
For large-capitalization Canadian stocks there is no longer a day-of-the week effect.
Speculative Bubbles
Sometimes a crowd of investors can behave as a single squirrel.
Слайд 28
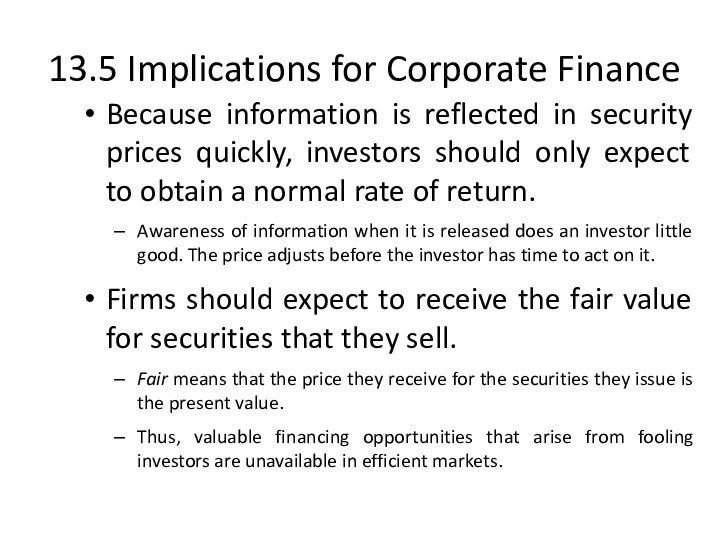
13.5 Implications for Corporate Finance
Because information is reflected
in security prices quickly, investors should only expect to
obtain a normal rate of return.
Awareness of information when it is released does an investor little good. The price adjusts before the investor has time to act on it.
Firms should expect to receive the fair value for securities that they sell.
Fair means that the price they receive for the securities they issue is the present value.
Thus, valuable financing opportunities that arise from fooling investors are unavailable in efficient markets.
Слайд 29
13.5 Implications for Corporate Finance
The EMH has three
implications for corporate finance:
The price of a company’s stock
cannot be affected by a change in accounting.
Financial managers cannot “time” issues of stocks and bonds using publicly available information.
A firm can sell as many shares of stocks or bonds as it desires without depressing prices.
There is conflicting empirical evidence on all three points.
Слайд 30
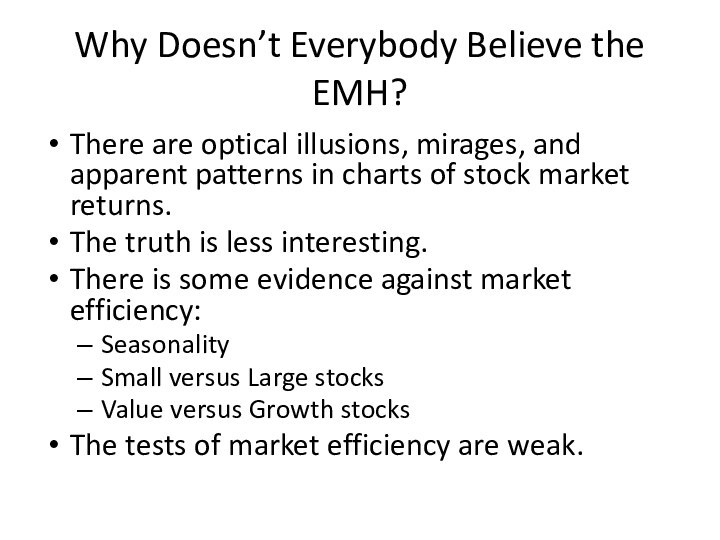
Why Doesn’t Everybody Believe the EMH?
There are optical
illusions, mirages, and apparent patterns in charts of stock
market returns.
The truth is less interesting.
There is some evidence against market efficiency:
Seasonality
Small versus Large stocks
Value versus Growth stocks
The tests of market efficiency are weak.
