- Главная
- Разное
- Бизнес и предпринимательство
- Образование
- Развлечения
- Государство
- Спорт
- Графика
- Культурология
- Еда и кулинария
- Лингвистика
- Религиоведение
- Черчение
- Физкультура
- ИЗО
- Психология
- Социология
- Английский язык
- Астрономия
- Алгебра
- Биология
- География
- Геометрия
- Детские презентации
- Информатика
- История
- Литература
- Маркетинг
- Математика
- Медицина
- Менеджмент
- Музыка
- МХК
- Немецкий язык
- ОБЖ
- Обществознание
- Окружающий мир
- Педагогика
- Русский язык
- Технология
- Физика
- Философия
- Химия
- Шаблоны, картинки для презентаций
- Экология
- Экономика
- Юриспруденция
Что такое findslide.org?
FindSlide.org - это сайт презентаций, докладов, шаблонов в формате PowerPoint.
Обратная связь
Email: Нажмите что бы посмотреть
Презентация на тему Коварные диаграммы
Содержание
- 8. Какую шкалу выбрать? Зависит от контекста и цели.
- 9. В жизни таких графиков не бывает? Бывает и не такое!
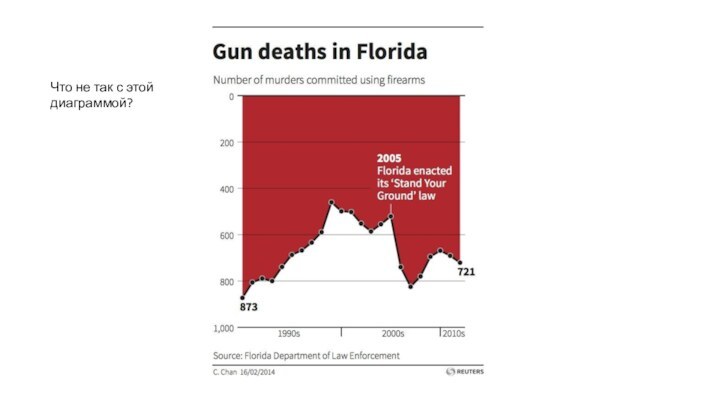
- 11. Что не так с этой диаграммой?
- 12. Внимание на три точки слева и на крайнюю правую.
- 13. In mid-December, the White House tweeted: “Good
- 14. Важно правильно выбрать тип диаграммы.
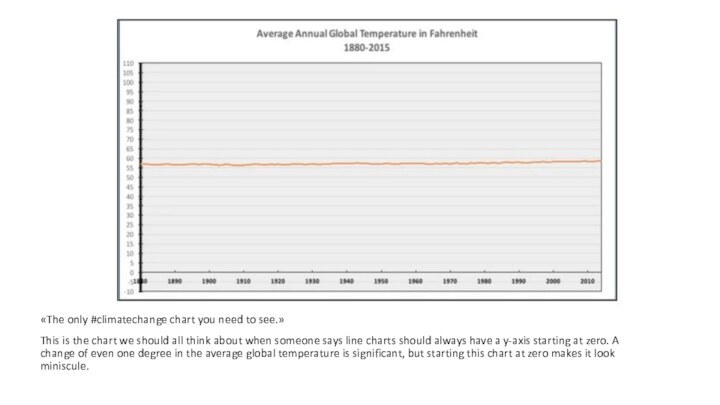
- 15. «The only #climatechange chart you need to
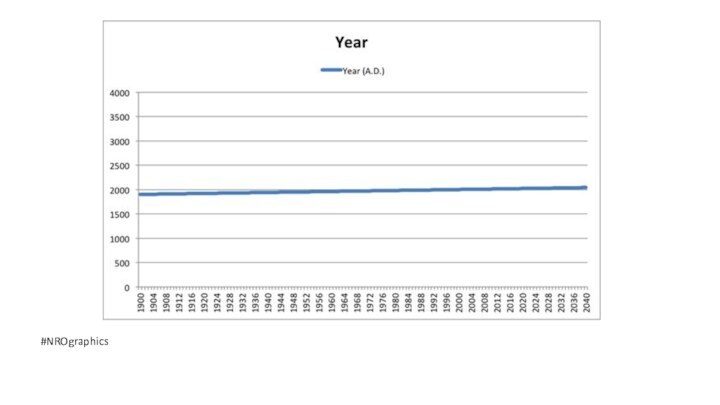
- 16. #NROgraphics
- 17. А как на самом деле?Не всегда стоит брать ось от нуля
- 19. Продажи Burger King в три раза больше продаж Starbucks. Но площади логотипов отличаются в 9 раз!
- 20. Gizmodo was trying to demonstrate that the
- 21. Возраст, с наступлением которого разрешается потребление спиртных
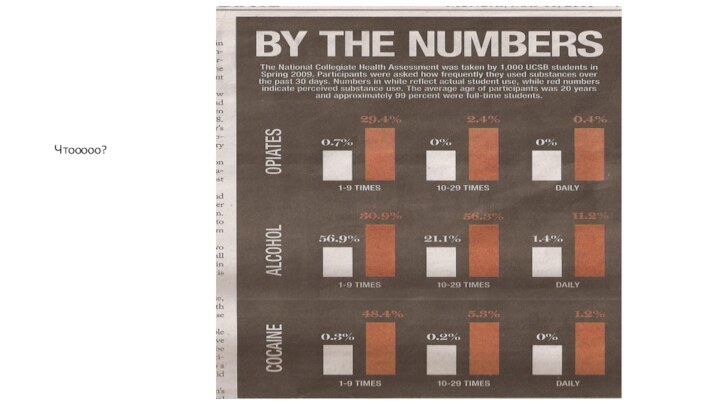
- 22. Чтооооо?
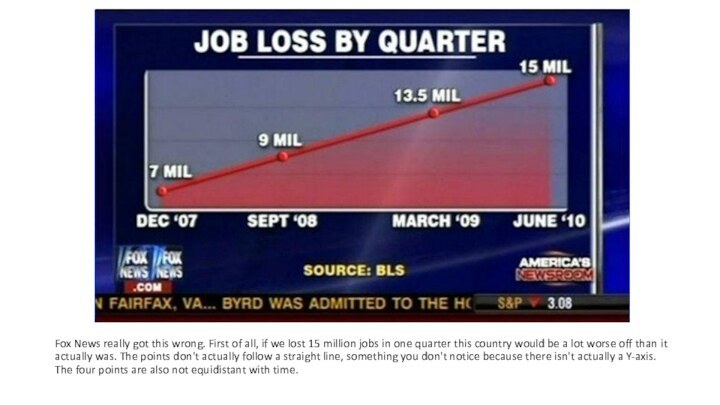
- 23. Fox News really got this wrong. First
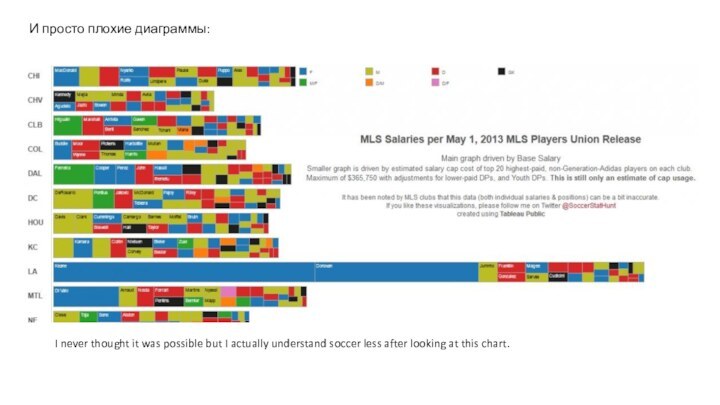
- 24. I never thought it was possible but
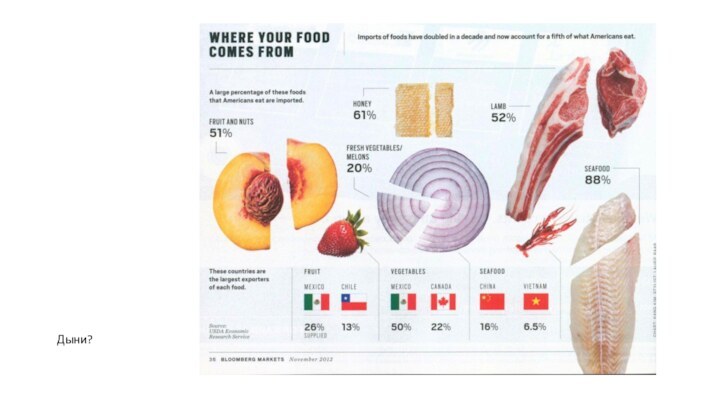
- 25. Дыни?
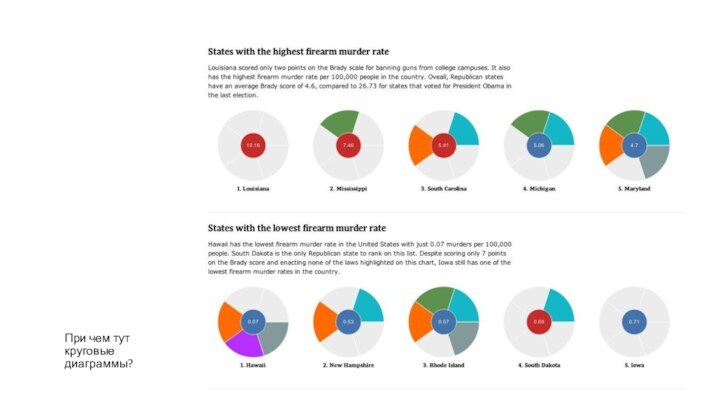
- 26. При чем тут круговые диаграммы?
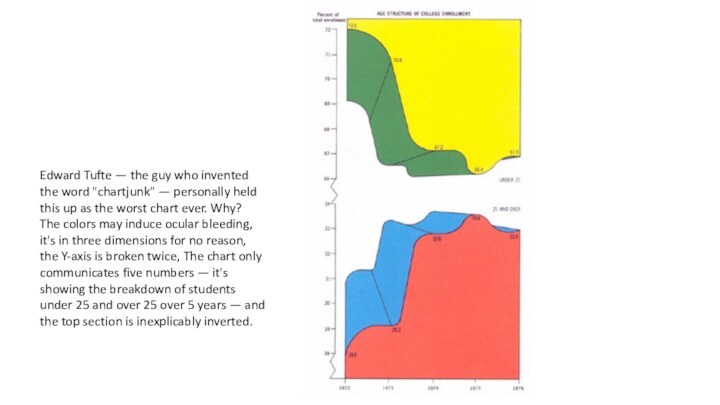
- 27. DataLiteracy Edward Tufte — the
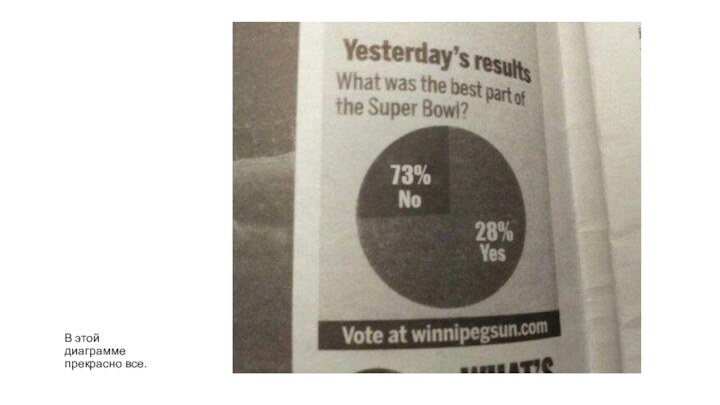
- 28. В этой диаграмме прекрасно все.
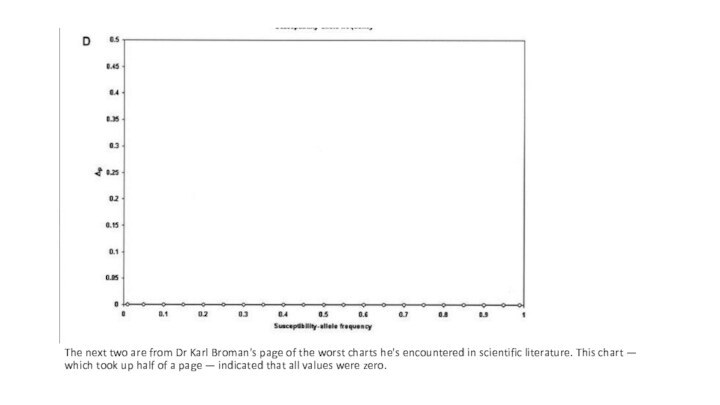
- 29. The next two are from Dr Karl
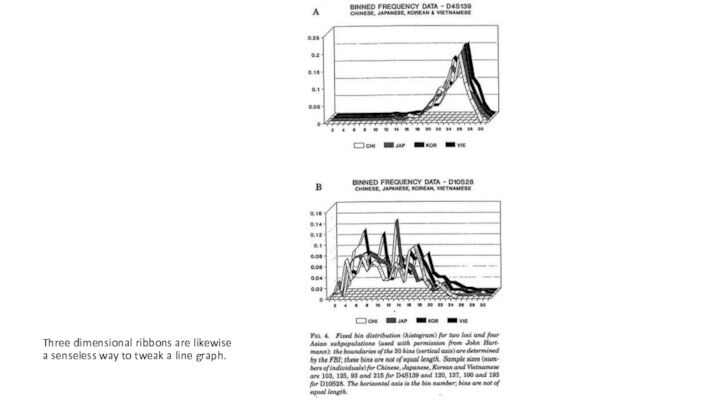
- 30. Three dimensional ribbons are likewise a senseless
- 31. Oops… Wall Street Journal
- 32. Скачать презентацию
- 33. Похожие презентации
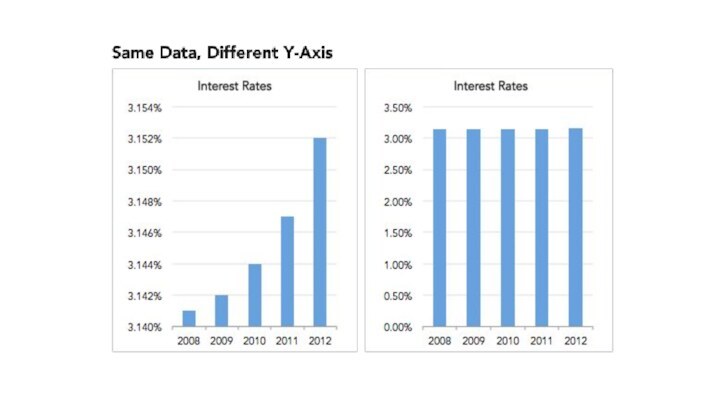
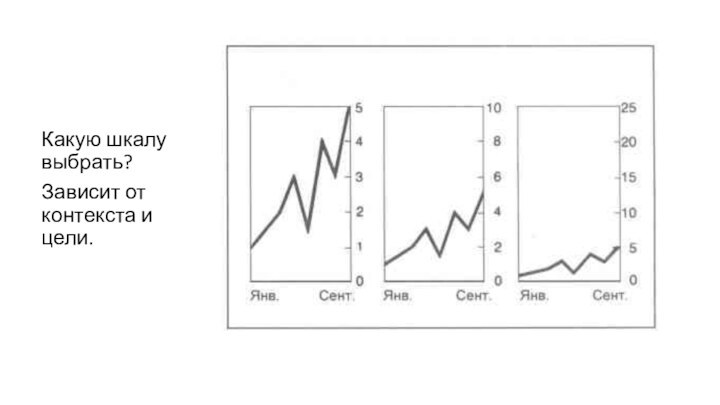
Какую шкалу выбрать? Зависит от контекста и цели.




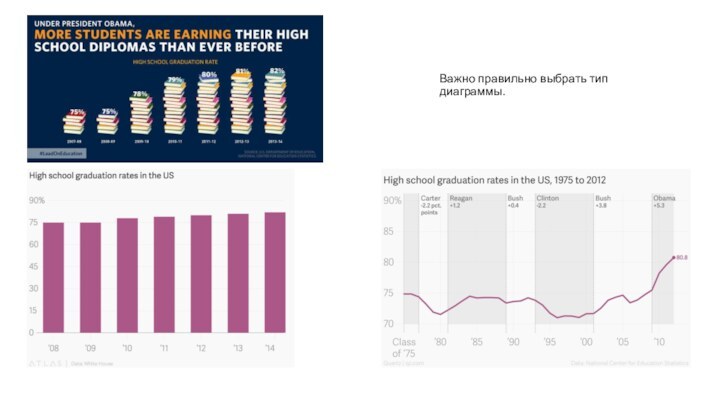



Слайд 13 In mid-December, the White House tweeted: “Good news:
America’s high school graduation rate has increased to an
all-time high.?”
Слайд 15
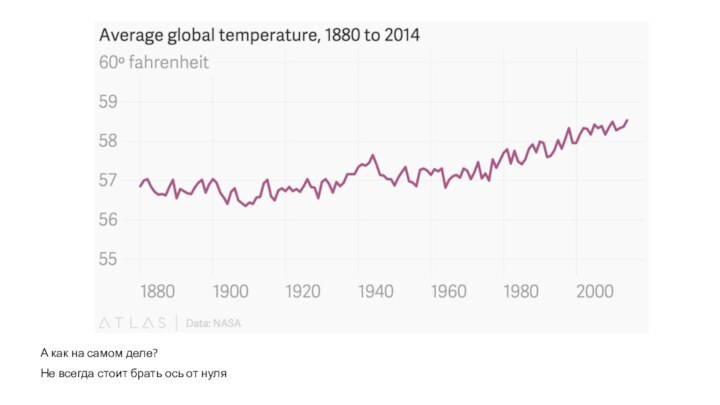
«The only #climatechange chart you need to see.»
This
is the chart we should all think about when
someone says line charts should always have a y-axis starting at zero. A change of even one degree in the average global temperature is significant, but starting this chart at zero makes it look miniscule.
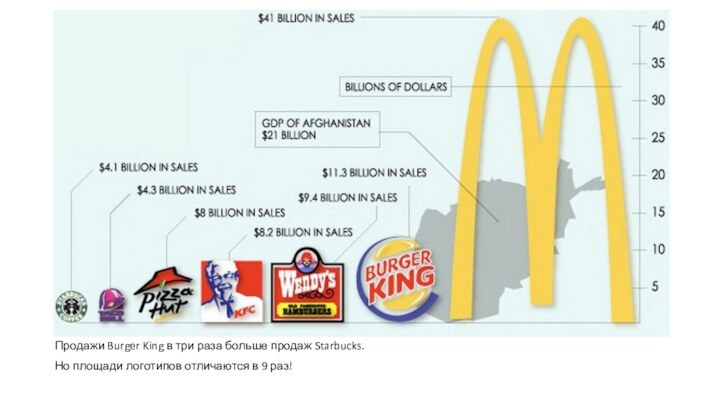
Слайд 19 Продажи Burger King в три раза больше продаж
Starbucks.
Но площади логотипов отличаются в 9 раз!
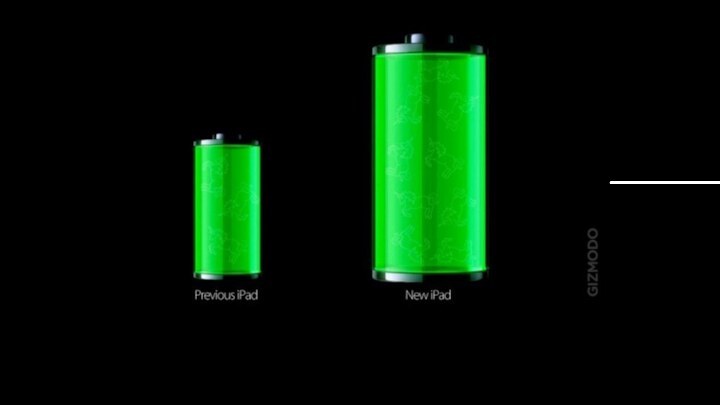
Слайд 20 Gizmodo was trying to demonstrate that the new
iPad battery gained 70% in capacity. They did this
by making the battery on right 70% taller than the battery on left. However, since they also expanded the width of a cylinder, the implied volume has skyrocketed of the battery. Whoops.
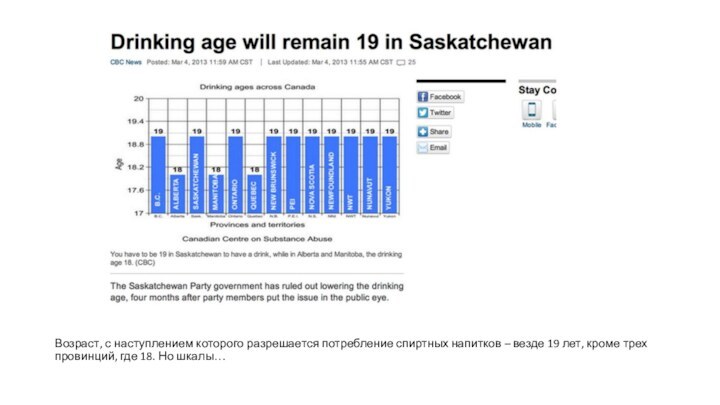
Слайд 21 Возраст, с наступлением которого разрешается потребление спиртных напитков
– везде 19 лет, кроме трех провинций, где 18.
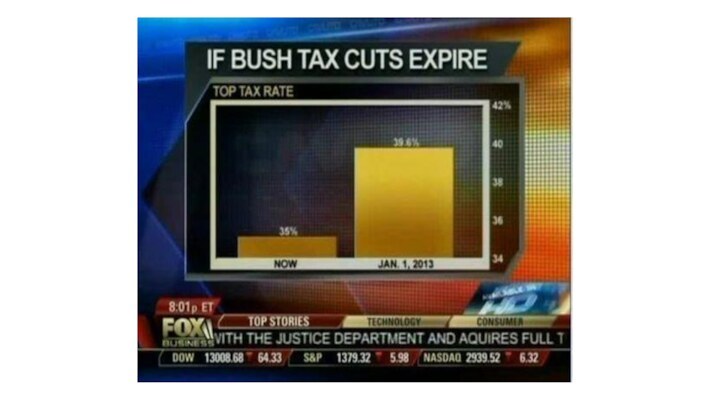
Но шкалы…Слайд 23 Fox News really got this wrong. First of
all, if we lost 15 million jobs in one
quarter this country would be a lot worse off than it actually was. The points don't actually follow a straight line, something you don't notice because there isn't actually a Y-axis. The four points are also not equidistant with time.
Media Matters
Слайд 24 I never thought it was possible but I
actually understand soccer less after looking at this chart.
И
просто плохие диаграммы:
Слайд 27
DataLiteracy
Edward Tufte — the guy who
invented the word "chartjunk" — personally held this up
as the worst chart ever. Why?The colors may induce ocular bleeding, it's in three dimensions for no reason, the Y-axis is broken twice, The chart only communicates five numbers — it's showing the breakdown of students under 25 and over 25 over 5 years — and the top section is inexplicably inverted.


