Слайд 2
Introductory information
Surface Area: 603,6 1000 sq km
Population:
45,5 Millions of inhabitants - 2010 (estimates after 2008)
Current
GDP: 102,9 Billions of euros - 2010 (estimates after 2009)
GDP per capita: 2.262,7 Euros - 2010 (estimates after 2008)
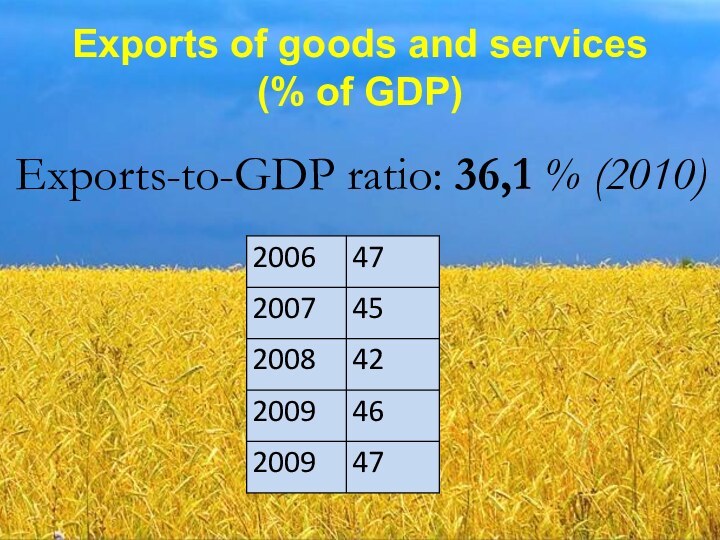
Exports-to-GDP ratio: 36,1 % (2010)
Imports-to-GDP ratio: 43,5 % (2010)
Trade-to-GDP ratio: 79,7 % (2010)
Слайд 4
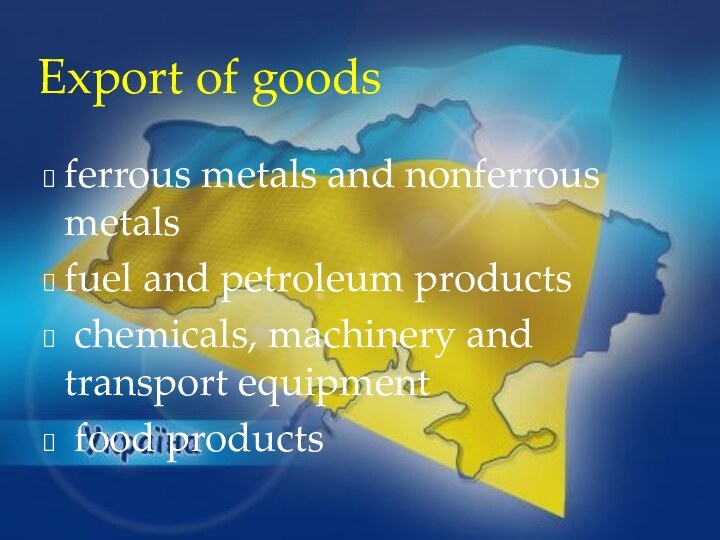
Export of goods
ferrous metals and nonferrous metals
fuel and
petroleum products
chemicals, machinery and transport equipment
food products
Слайд 5
EXPORTS OF SERVICES
Transportation
Travel
Construction services
Financial services
Communication services
Insurance services
Computer
and information services
Royalties and license fees
Advertising, market research
Research and
development
Architectural, engineering and other technical services
Legal, accounting, management consulting and public relations
Agricultural, mining and on-site processing services
Government services
Other services
Слайд 6
Exports of goods and services (% of GDP)
Exports-to-GDP
ratio: 36,1 % (2010)
Слайд 7
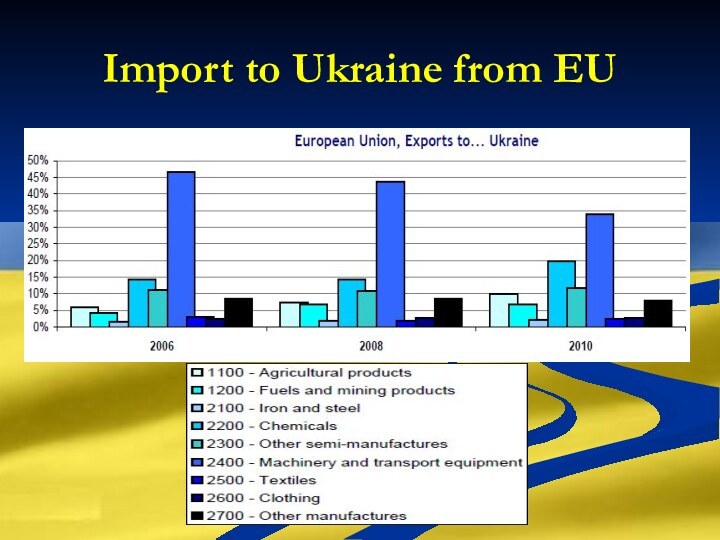
Import
Energy
Machinery and equipment
Chemicals
Machinery and transport equipment
Textile and
clothes
Other products
Слайд 8
Agricultural products
Ukrainian import
Fuel and mining products
Chemicals
Machinery and transport
equipment
Textile and clothes
Other products
Millions of euros
Слайд 10
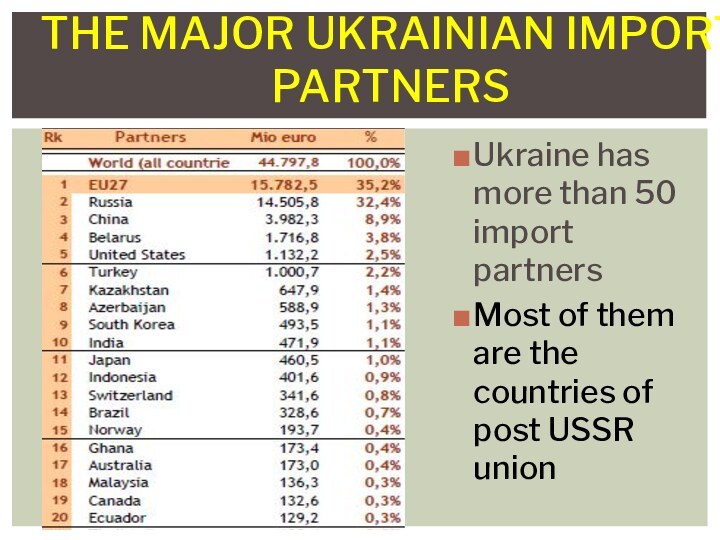
Ukraine has more than 50 import partners
Most of
them are the countries of post USSR union
The major
Ukrainian import partners
Слайд 11
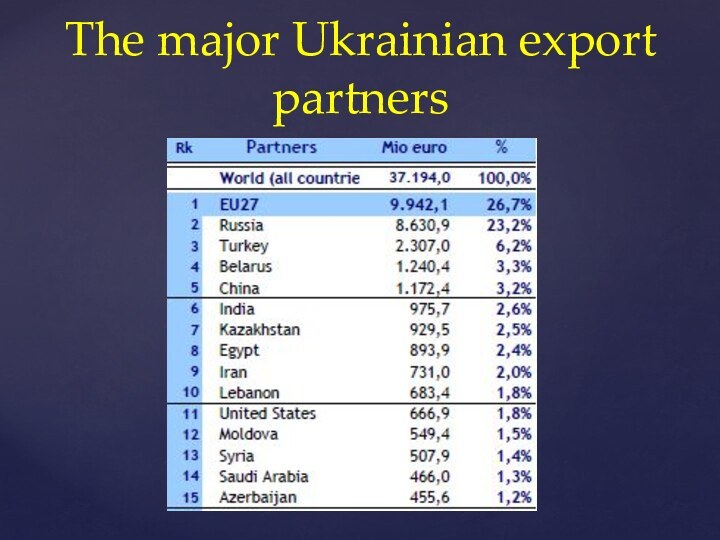
The major Ukrainian export partners
Слайд 12
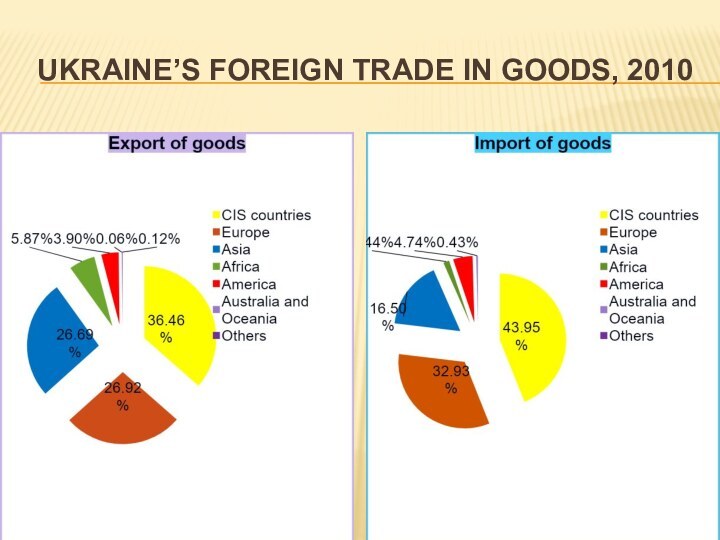
Ukraine’s Foreign Trade in Goods, 2010
Слайд 13
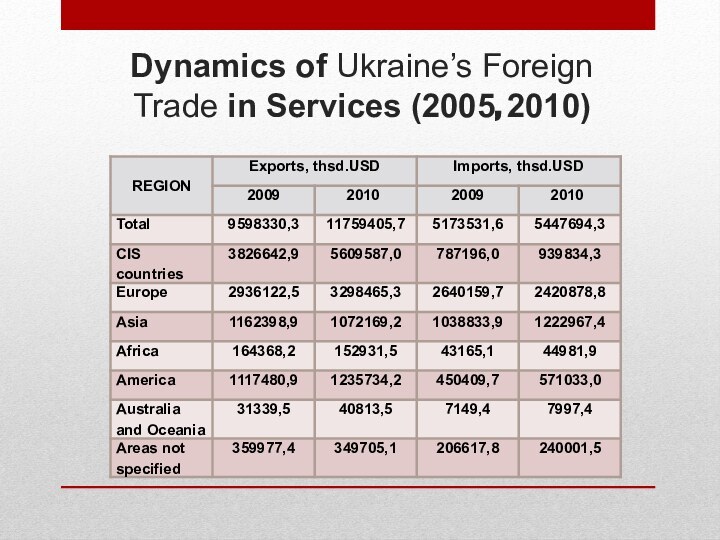
Dynamics of Ukraine’s Foreign Trade in Services (2005,
2010)
Слайд 14
Ukraine’s Foreign Trade in Goods, 2010
Слайд 15
Exports of Services
(2009, 2010)
Слайд 16
Imports of Services
(2009, 2010)
Слайд 17
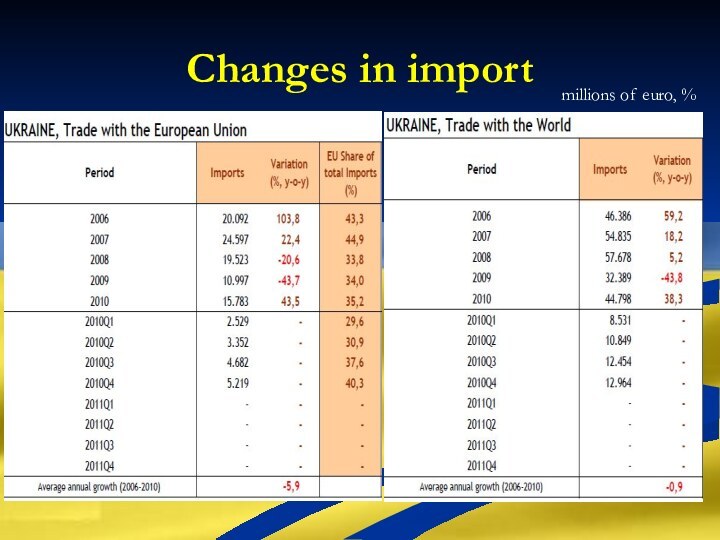
Changes in import
millions of euro, %
Слайд 18
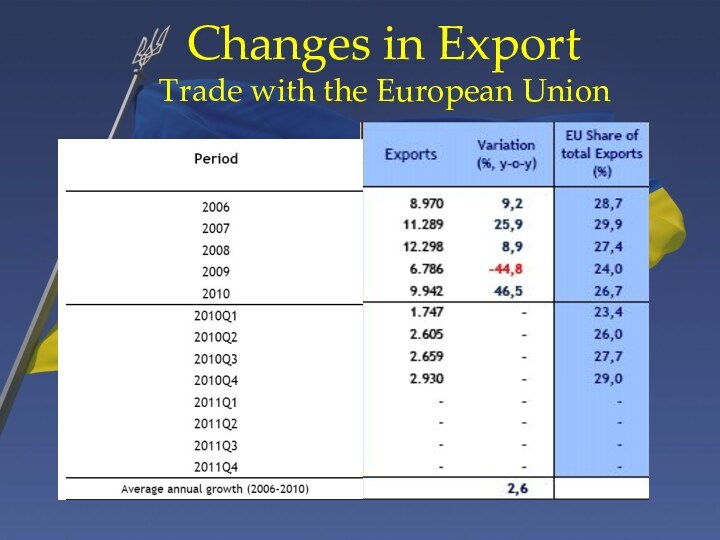
Changes in Export
Trade with the European Union
Слайд 19
Changes in Export
Trade with the World
Слайд 20
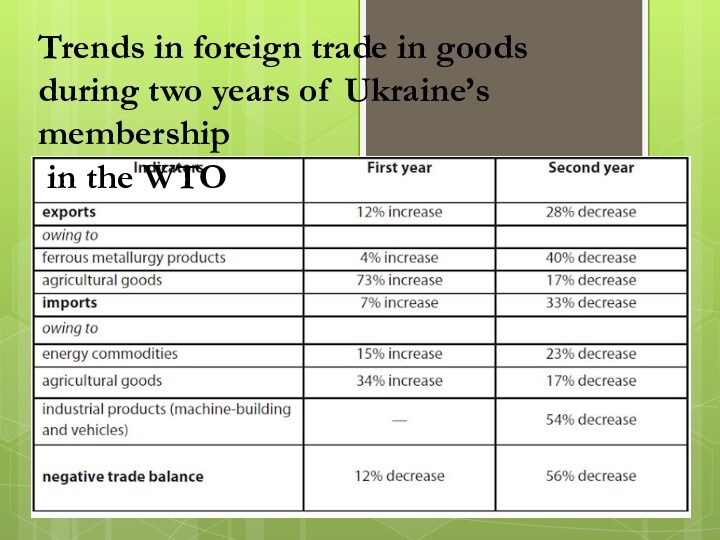
The result of two-year membership in WTO
Слайд 21
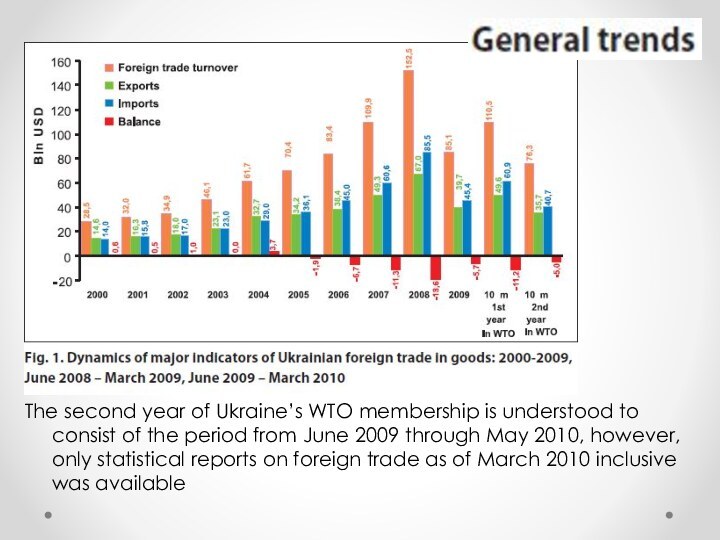
The second year of Ukraine’s WTO membership is
understood to consist of the period from June 2009
through May 2010, however, only statistical reports on foreign trade as of March 2010 inclusive was available
Слайд 23
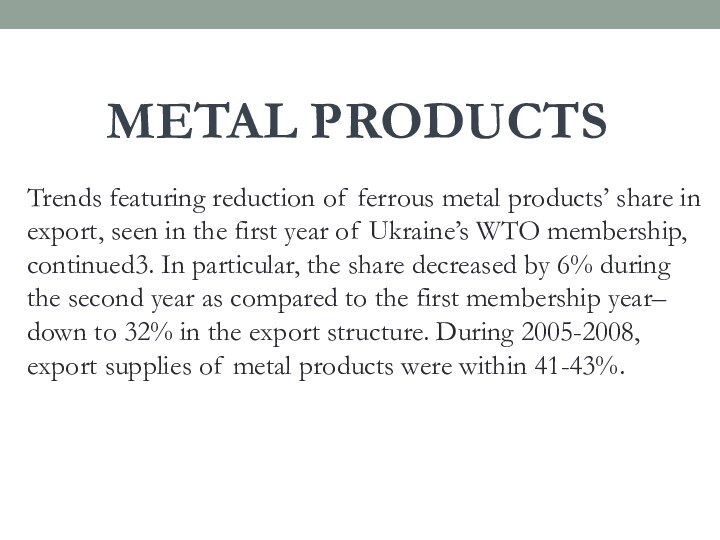
Trends featuring reduction of ferrous metal products’ share
in export, seen in the first year of Ukraine’s
WTO membership, continued3. In particular, the share decreased by 6% during the second year as compared to the first membership year– down to 32% in the export structure. During 2005-2008, export supplies of metal products were within 41-43%.
METAL PRODUCTS
Слайд 24
Agriculture is the only
sector in Ukraine demonstrating growth during the financial and
economic crisis: for example, gross output growth in 2009 was 0.1% year-on-year. All other sectors demonstrated production decline indicators. Positive results of agricultural operations became possible due to successful export activities as well.
Agricultural products
Слайд 25
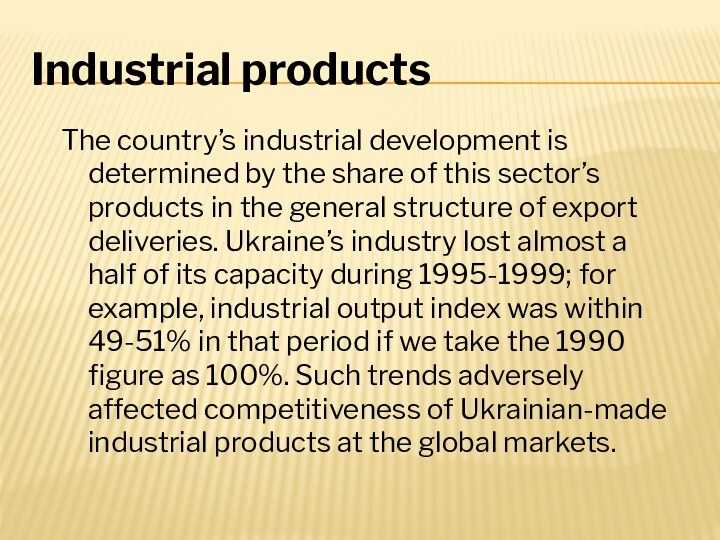
Industrial products
The country’s industrial development is determined by
the share of this sector’s products in the general
structure of export deliveries. Ukraine’s industry lost almost a half of its capacity during 1995-1999; for example, industrial output index was within 49-51% in that period if we take the 1990 figure as 100%. Such trends adversely affected competitiveness of Ukrainian-made industrial products at the global markets.
Слайд 26
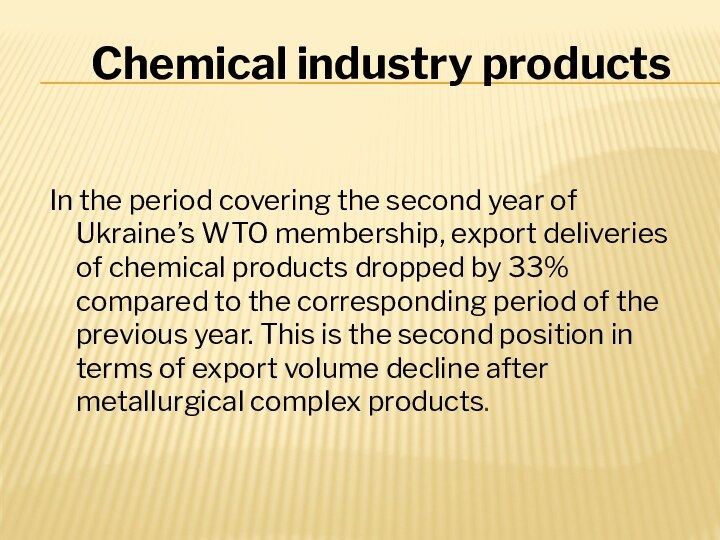
Chemical industry products
In the period covering the second
year of Ukraine’s WTO membership, export deliveries of chemical
products dropped by 33% compared to the corresponding period of the previous year. This is the second position in terms of export volume decline after metallurgical complex products.
Слайд 27
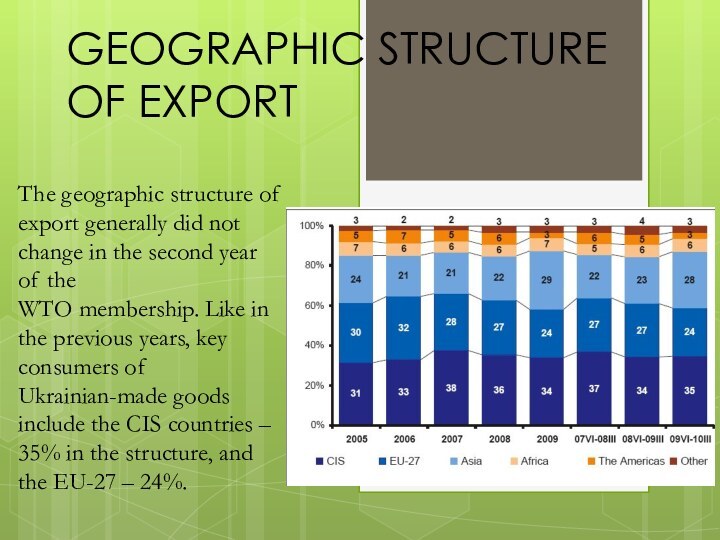
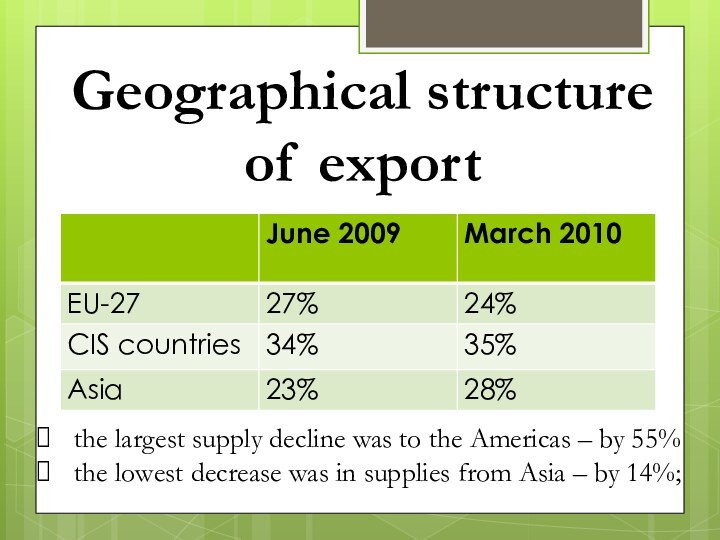
GEOGRAPHIC STRUCTURE OF EXPORT
The geographic structure of export
generally did not change in the second year of
the
WTO membership. Like in the previous years, key consumers of Ukrainian-made goods
include the CIS countries – 35% in the structure, and the EU-27 – 24%.
Слайд 28
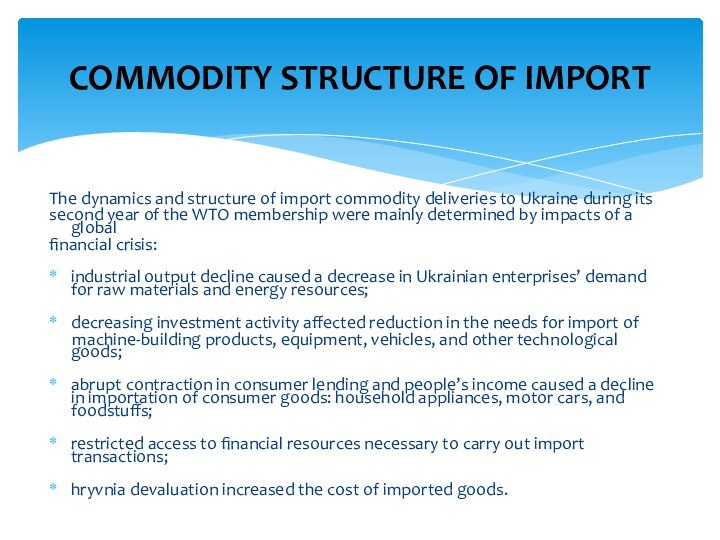
The dynamics and structure of import commodity deliveries
to Ukraine during its
second year of the WTO
membership were mainly determined by impacts of a global
financial crisis:
industrial output decline caused a decrease in Ukrainian enterprises’ demand for raw materials and energy resources;
decreasing investment activity affected reduction in the needs for import of
machine-building products, equipment, vehicles, and other technological goods;
abrupt contraction in consumer lending and people’s income caused a decline in importation of consumer goods: household appliances, motor cars, and foodstuffs;
restricted access to financial resources necessary to carry out import transactions;
hryvnia devaluation increased the cost of imported goods.
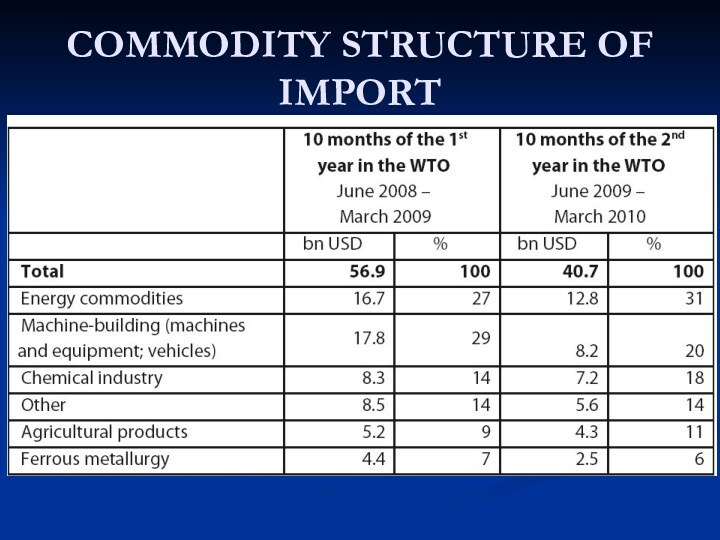
COMMODITY STRUCTURE OF IMPORT
Слайд 30
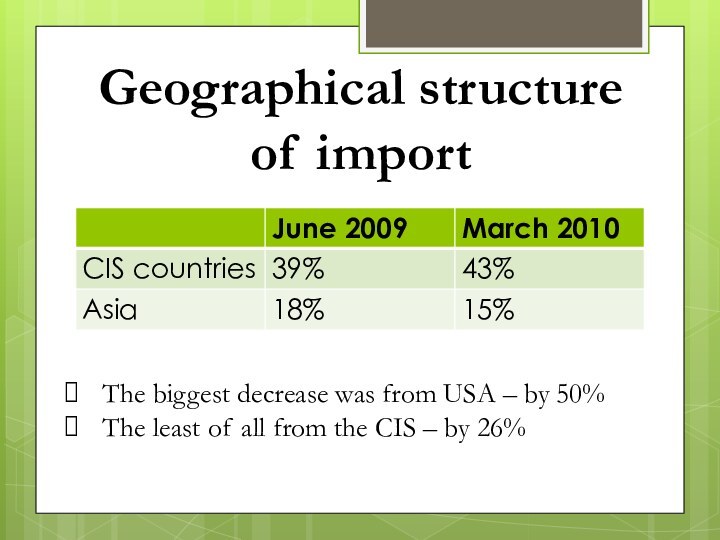
GEOGRAPHIC STRUCTURE OF IMPORT
The
global financial crisis also affected the geographic structure of
import commodity deliveries to Ukraine. A tendency toward decrease in the CIS share, seen in the previous year, stopped ; besides, imports to Ukraine from the CIS countries in value terms declined the least as compared with other regions of the world – by 26%, whereas total import reduction amounted to 33%.
Слайд 31
Internal taxes (VAT, excise)
Ensuring a national treatment
concerning internal taxation and regulation is a basic WTO
principle, i.e. imported goods shall be granted no less favourable treatment than domestic ones.
Слайд 32
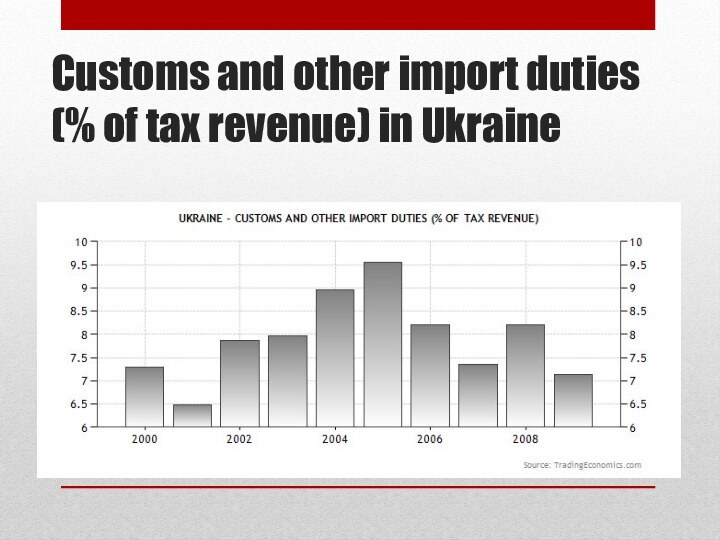
Customs and other import duties (% of tax
revenue) in Ukraine
Слайд 33
Taxes on international trade (% of revenue) in
Ukraine
Слайд 34
Taxes on exports (current LCU) in Ukraine
Слайд 35
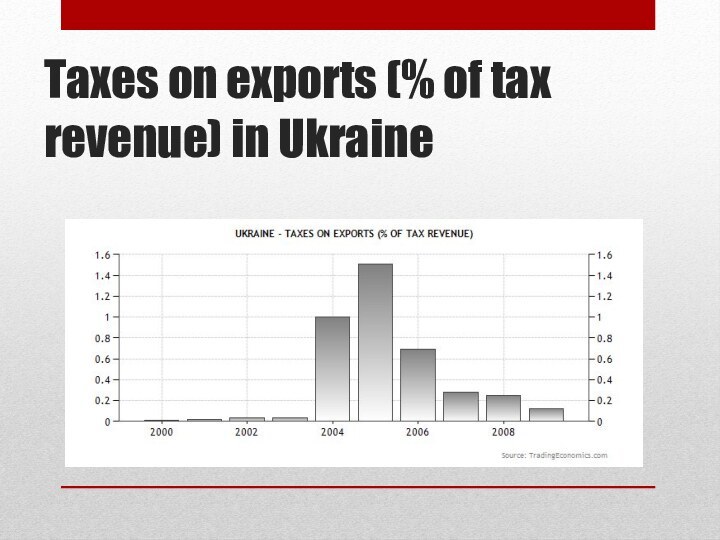
Taxes on exports (% of tax revenue) in
Ukraine
Слайд 36
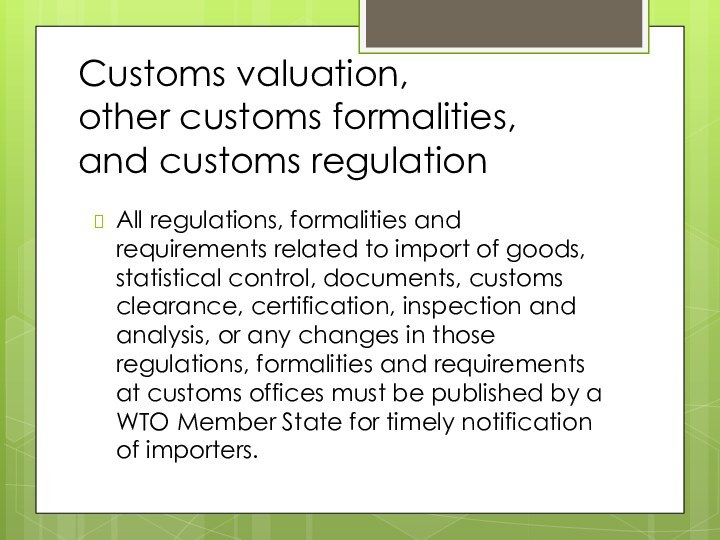
Customs valuation,
other customs formalities,
and customs regulation
All regulations,
formalities and requirements related to import of goods, statistical
control, documents, customs clearance, certification, inspection and analysis, or any changes in those regulations, formalities and requirements at customs offices must be published by a WTO Member State for timely notification of importers.
Слайд 37
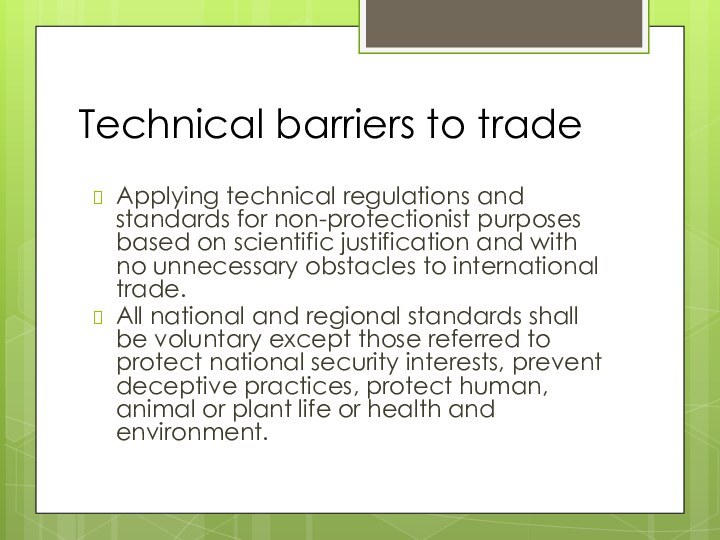
Technical barriers to trade
Applying technical regulations and
standards for non-protectionist purposes based on scientific justification and
with no unnecessary obstacles to international trade.
All national and regional standards shall be voluntary except those referred to protect national security interests, prevent deceptive practices, protect human, animal or plant life or health and environment.
Слайд 38
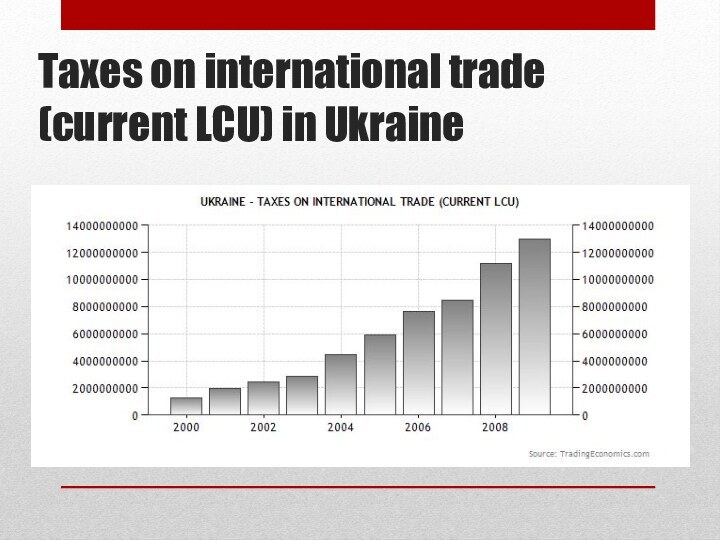
Taxes on international trade (current LCU) in Ukraine
Слайд 39
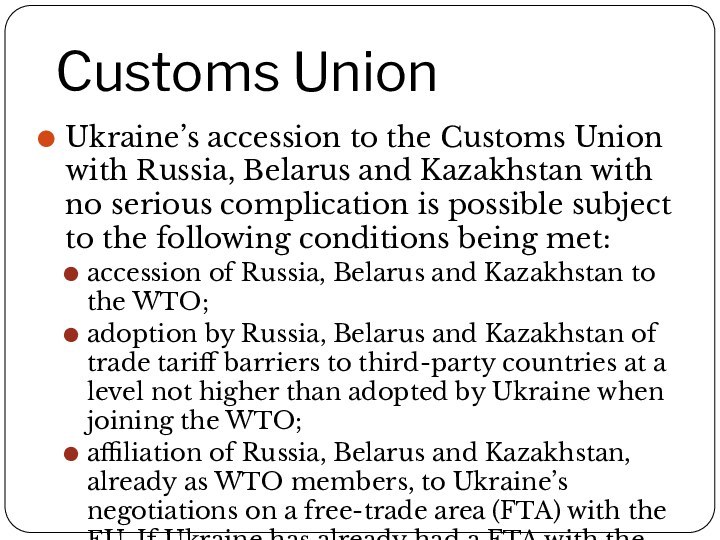
Customs Union
Ukraine’s accession to the Customs Union with
Russia, Belarus and Kazakhstan with no serious complication is
possible subject to the following conditions being met:
accession of Russia, Belarus and Kazakhstan to the WTO;
adoption by Russia, Belarus and Kazakhstan of trade tariff barriers to third-party countries at a level not higher than adopted by Ukraine when joining the WTO;
affiliation of Russia, Belarus and Kazakhstan, already as WTO members, to Ukraine’s negotiations on a free-trade area (FTA) with the EU. If Ukraine has already had a FTA with the EU at that moment, the FTA will be established on terms agreed between the five countries.
Слайд 40
Customs Union
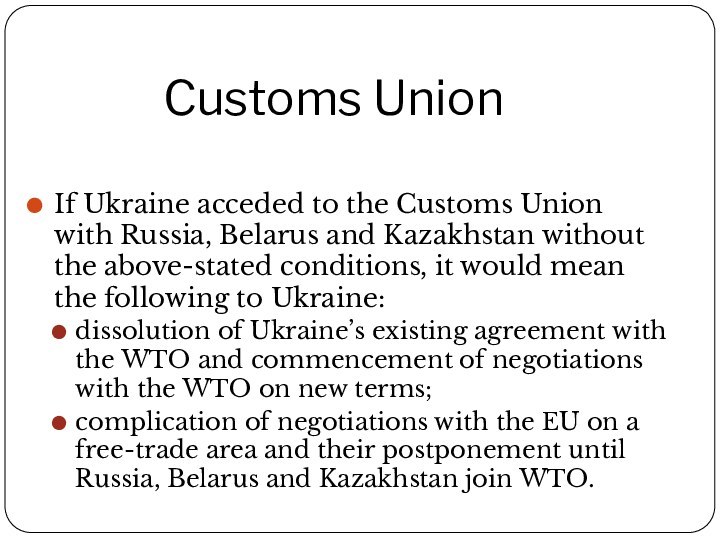
If Ukraine acceded to the Customs Union
with Russia, Belarus and Kazakhstan without the above-stated conditions,
it would mean the following to Ukraine:
dissolution of Ukraine’s existing agreement with the WTO and commencement of negotiations with the WTO on new terms;
complication of negotiations with the EU on a free-trade area and their postponement until Russia, Belarus and Kazakhstan join WTO.
Слайд 41
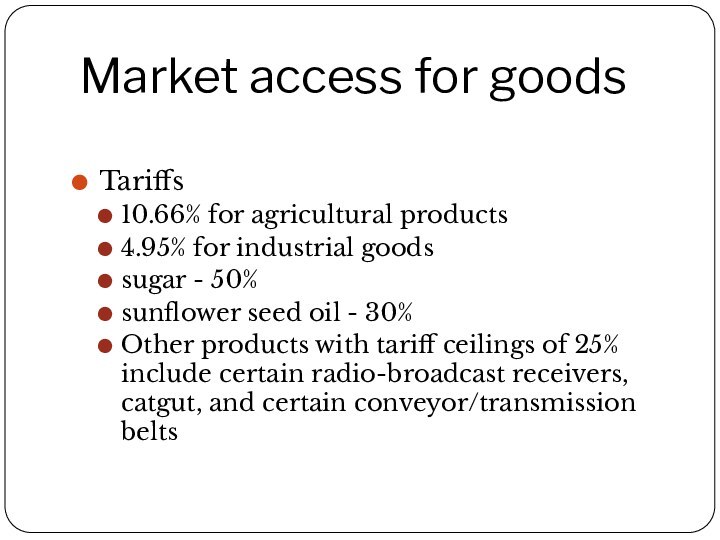
Market access for goods
Tariffs
10.66% for agricultural products
4.95% for industrial goods
sugar - 50%
sunflower seed oil -
30%
Other products with tariff ceilings of 25% include certain radio-broadcast receivers, catgut, and certain conveyor/transmission belts
Слайд 42
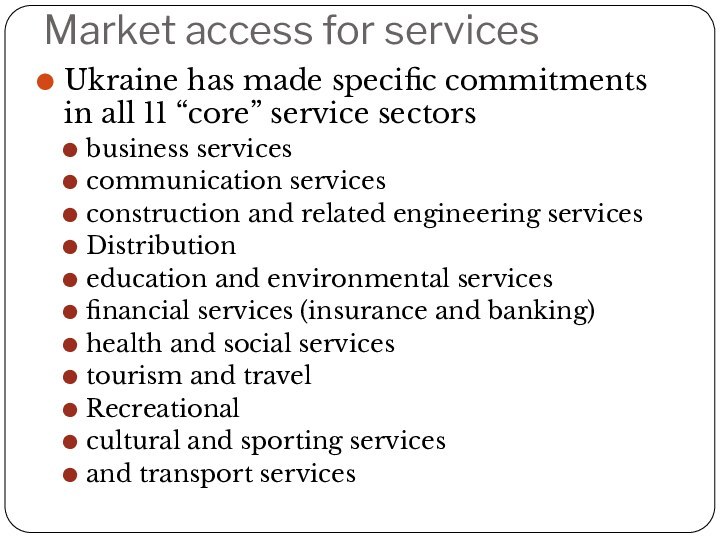
Market access for services
Ukraine has made specific
commitments in all 11 “core” service sectors
business services
communication
services
construction and related engineering services
Distribution
education and environmental services
financial services (insurance and banking)
health and social services
tourism and travel
Recreational
cultural and sporting services
and transport services
Слайд 43
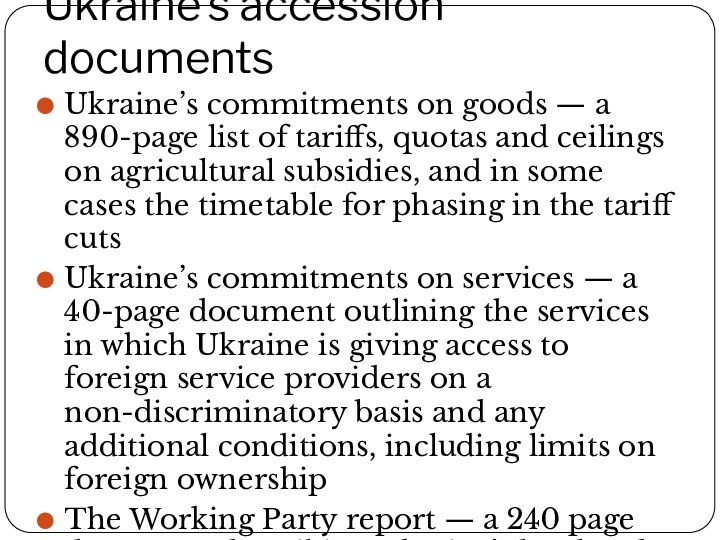
Ukraine’s accession documents
Ukraine’s commitments on goods —
a 890-page list of tariffs, quotas and ceilings on
agricultural subsidies, and in some cases the timetable for phasing in the tariff cuts
Ukraine’s commitments on services — a 40-page document outlining the services in which Ukraine is giving access to foreign service providers on a non-discriminatory basis and any additional conditions, including limits on foreign ownership
The Working Party report — a 240 page document describing Ukraine’s legal and institutional set up for trade, along with commitments it has made in many of the areas covered by the report.
Слайд 44
Merchandise exports: USD38.368 billion
Merchandise imports: USD45.035 billion
Merchandise exports/imports
(2006)
Services exports/imports
(2006)
Commercial services exports: USD10.671 billion
Commercial
services imports: USD8.484 billion
Слайд 45
Trends in foreign trade in goods
during two years
of Ukraine’s membership
in the WTO
Слайд 46
Geographical structure
of export
the largest supply decline was to
the Americas – by 55%
the lowest decrease was
in supplies from Asia – by 14%;
Слайд 47
Geographical structure
of import
The biggest decrease was from USA
– by 50%
The least of all from the CIS
– by 26%
Слайд 48
high yields of grain and oil-bearing crops in
2008-2009;
favourable pricing environment at global markets;
hryvnia devaluation in 2008-2009
also improved competitiveness of Ukrainianmade
agricultural products;
due to the financial crisis, freight rates became substantially lower than before
the crisis;
lifting and non-introduction by the Ukrainian government of new quantitative
export restrictions for agriculture that do not comply with the WTO
requirements.
Reasons for the lowest decline
of export supplies
Слайд 49
Reasons of dynamics of import:
decreasing investment activity affected
reduction in the needs for import of
machine-building products, equipment,
vehicles, and other technological goods;
industrial output decline caused a decrease in Ukrainian enterprises’ demand for
raw materials and energy resources;
abrupt contraction in consumer lending and people’s income caused a decline in
importation of consumer goods: household appliances, motor cars, and foodstuffs;
restricted access to financial resources necessary to carry out import transactions;
hryvnia devaluation increased the cost of imported goods.
Слайд 50
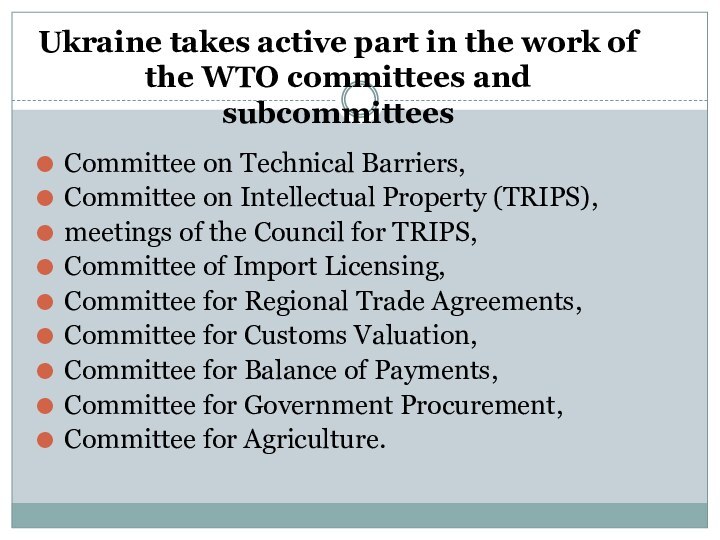
Ukraine takes active part in the work of
the WTO committees and
subcommittees
Committee on Technical Barriers,
Committee on Intellectual
Property (TRIPS),
meetings of the Council for TRIPS,
Committee of Import Licensing,
Committee for Regional Trade Agreements,
Committee for Customs Valuation,
Committee for Balance of Payments,
Committee for Government Procurement,
Committee for Agriculture.
Слайд 51
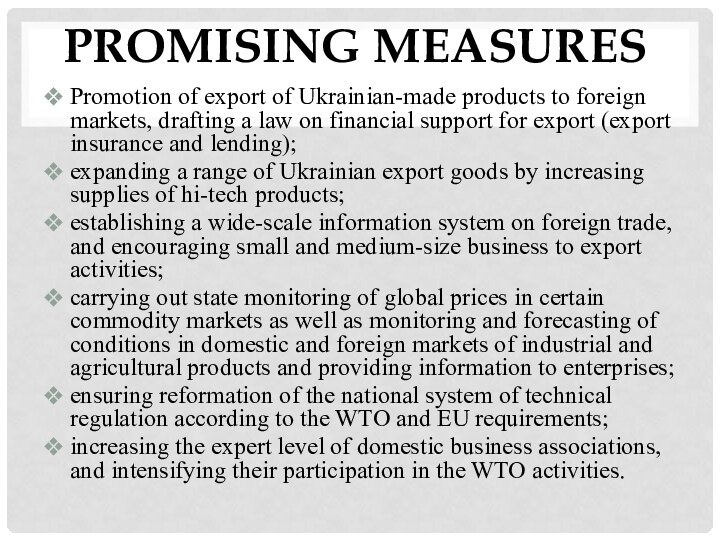
Promising measures
Promotion of export of Ukrainian-made products to
foreign markets, drafting a law on financial support for
export (export insurance and lending);
expanding a range of Ukrainian export goods by increasing supplies of hi-tech products;
establishing a wide-scale information system on foreign trade, and encouraging small and medium-size business to export activities;
carrying out state monitoring of global prices in certain commodity markets as well as monitoring and forecasting of conditions in domestic and foreign markets of industrial and agricultural products and providing information to enterprises;
ensuring reformation of the national system of technical regulation according to the WTO and EU requirements;
increasing the expert level of domestic business associations, and intensifying their participation in the WTO activities.
