organization
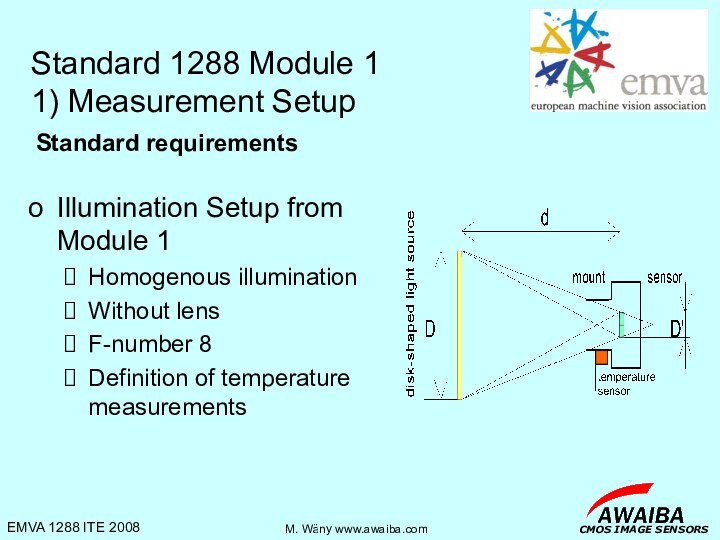
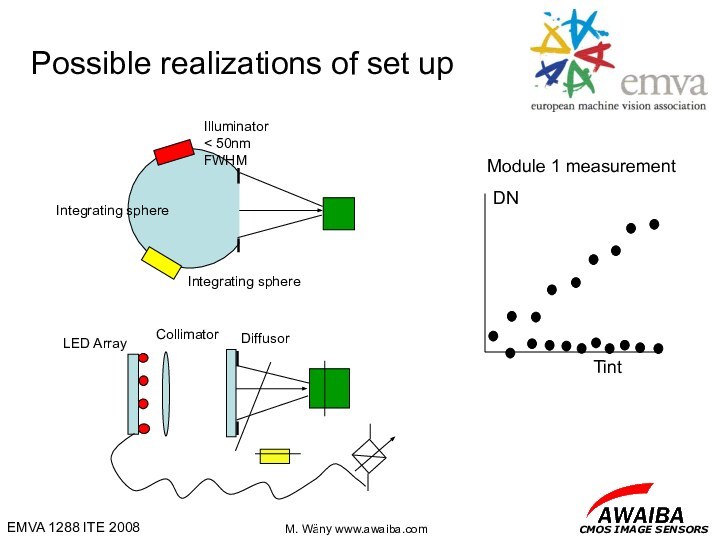
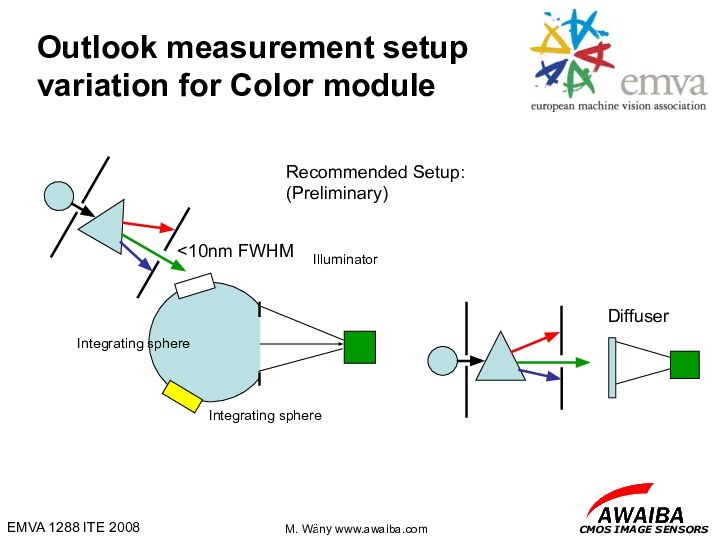
Measurement setup
1288 Module 1 “in 12 Slides”
Interpretation of the
standard for the userAgenda
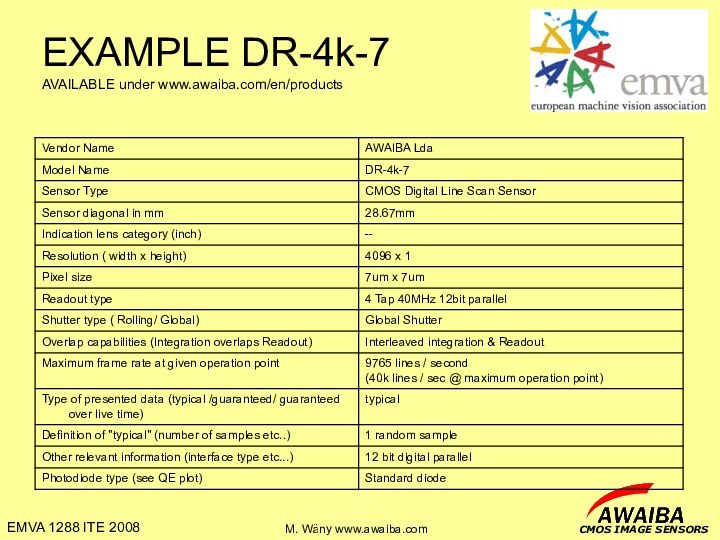
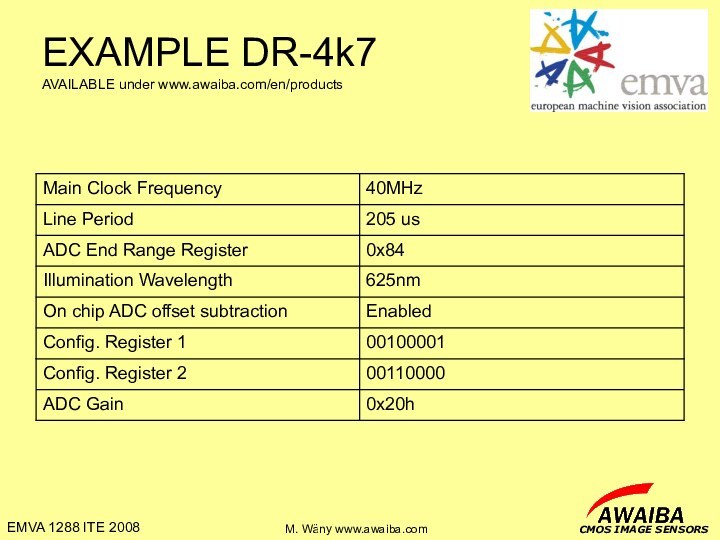
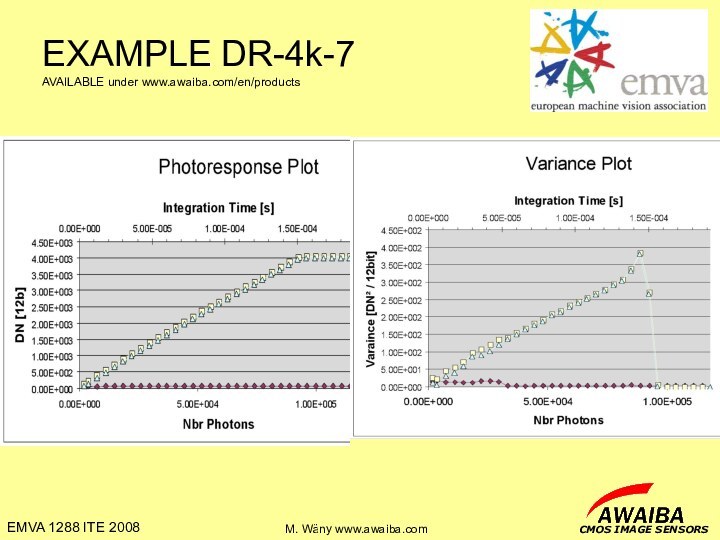
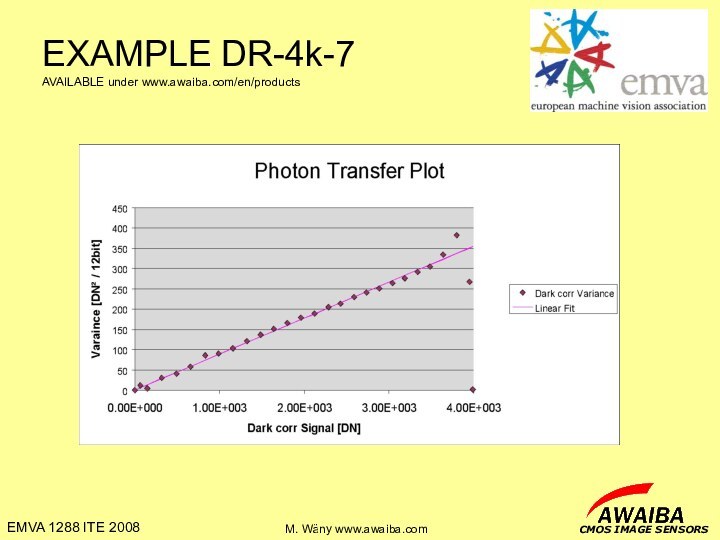
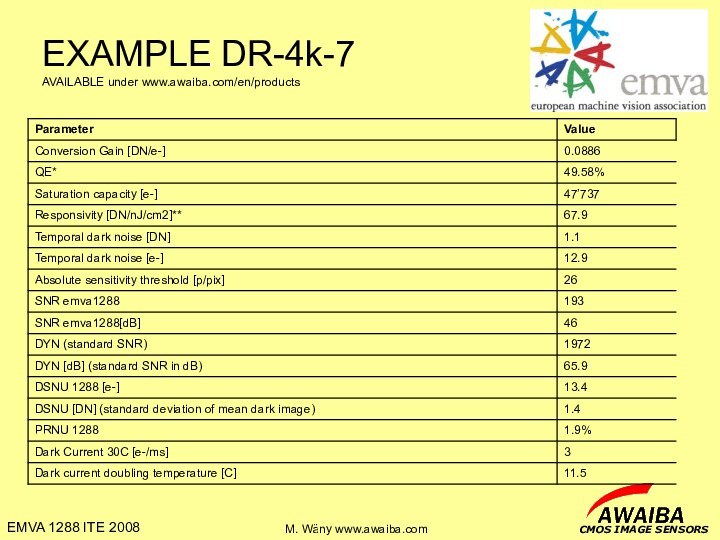
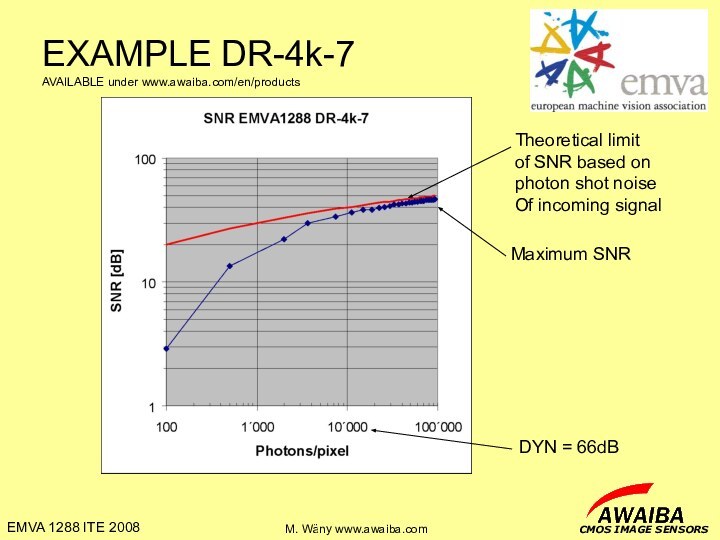
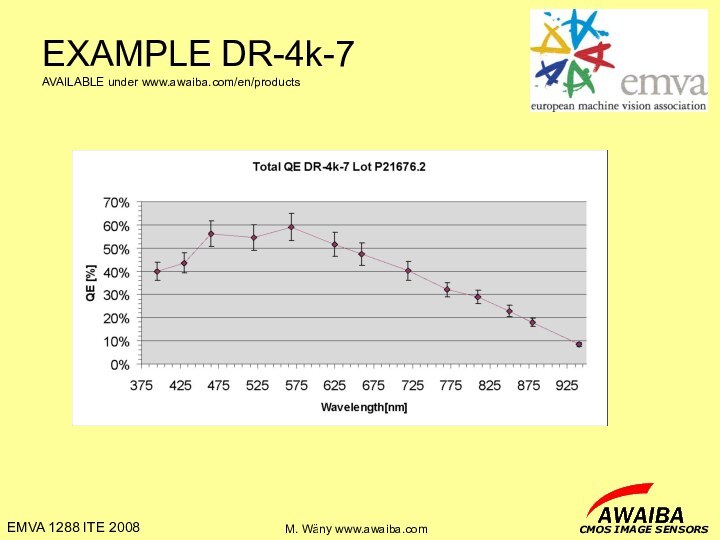
Example DR-4k-7
FindSlide.org - это сайт презентаций, докладов, шаблонов в формате PowerPoint.
Email: Нажмите что бы посмотреть
Agenda
Example DR-4k-7
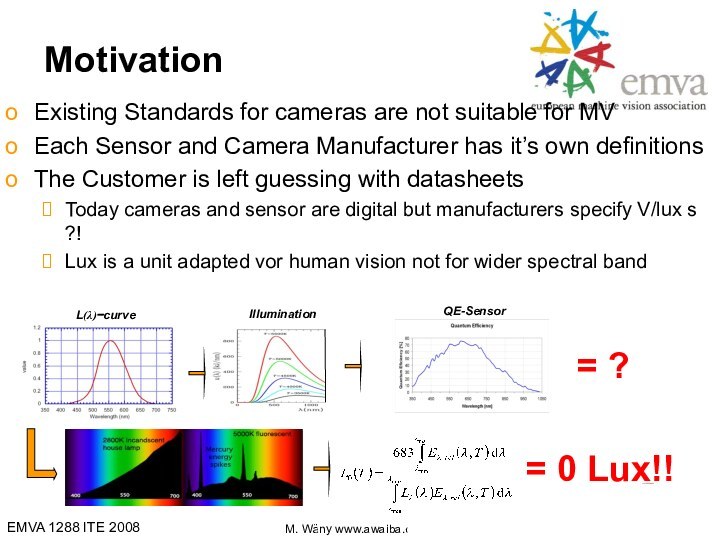
L(λ)−curve
QE-Sensor
Illumination
= 0 Lux!!
= ?
Supported world wide by agreement between JIIA, AIA & EMVA on G3 standardization frame work
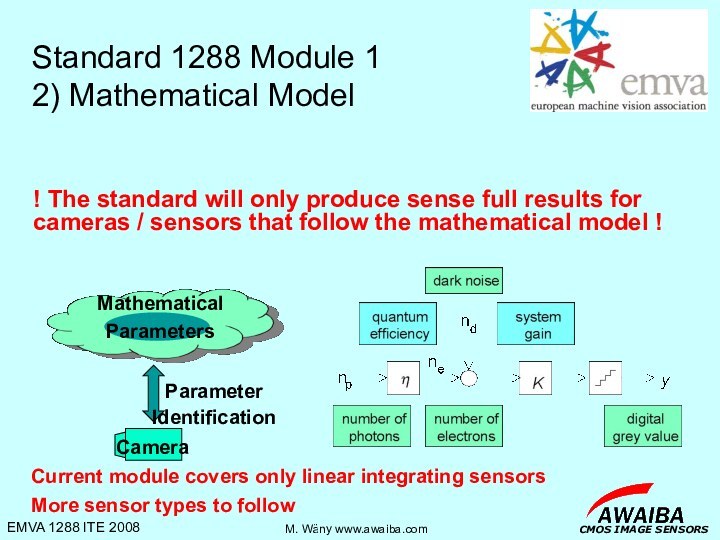
Current module covers only linear integrating sensors
More sensor types to follow
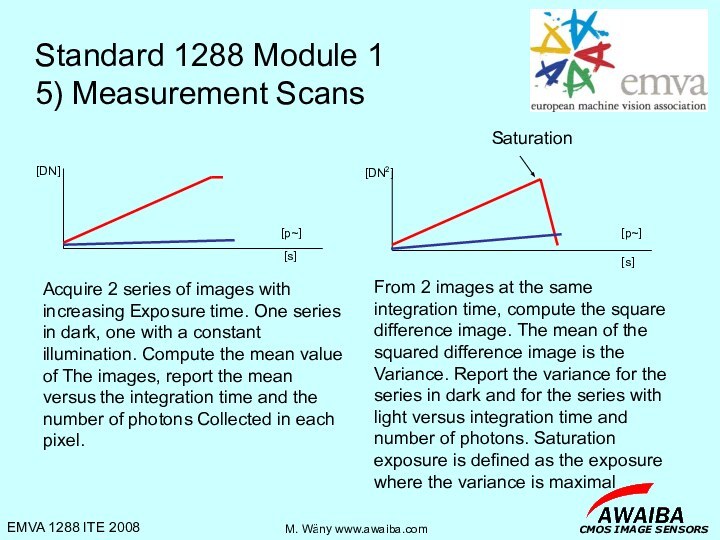
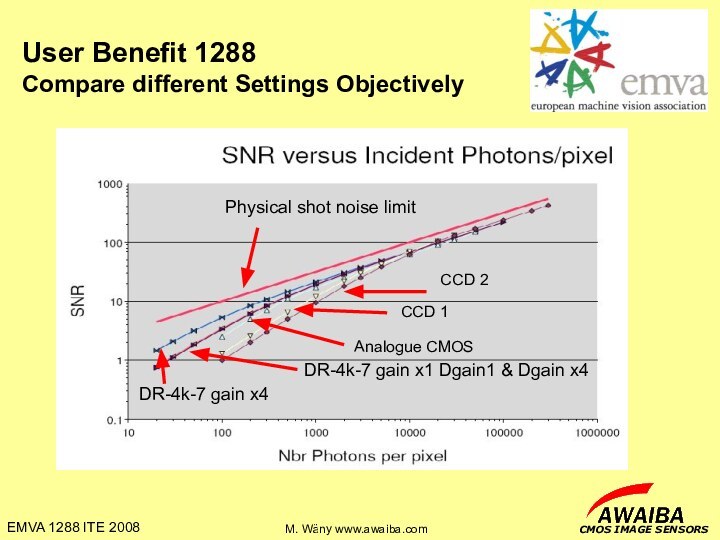
From 2 images at the same integration time, compute the square difference image. The mean of the squared difference image is the Variance. Report the variance for the series in dark and for the series with light versus integration time and number of photons. Saturation exposure is defined as the exposure where the variance is maximal
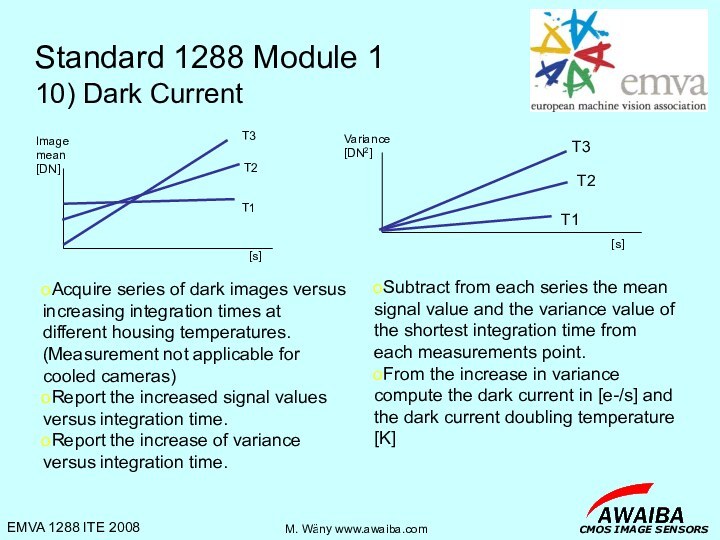
Subtract from each series the mean signal value and the variance value of the shortest integration time from each measurements point.
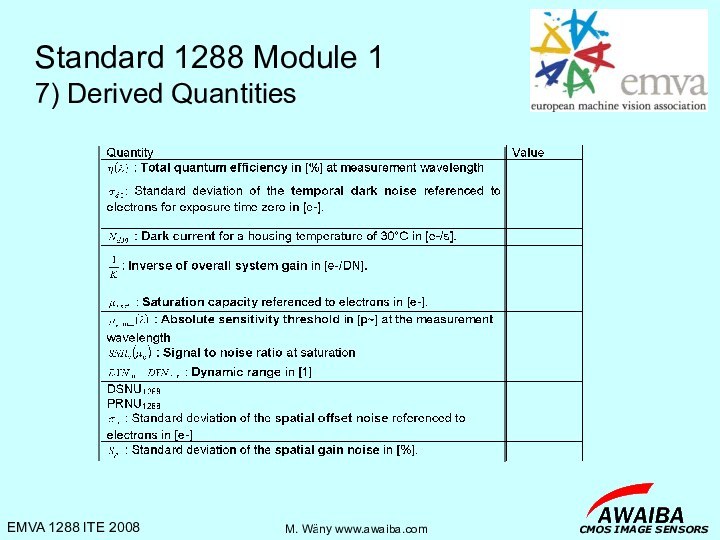
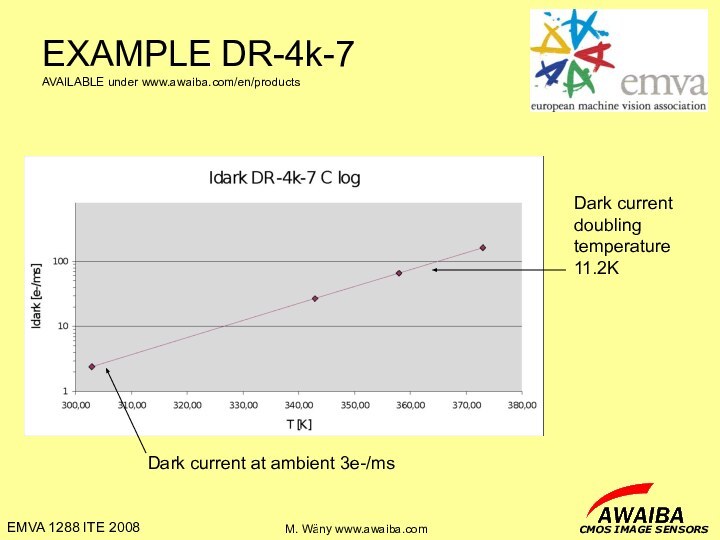
From the increase in variance compute the dark current in [e-/s] and the dark current doubling temperature [K]
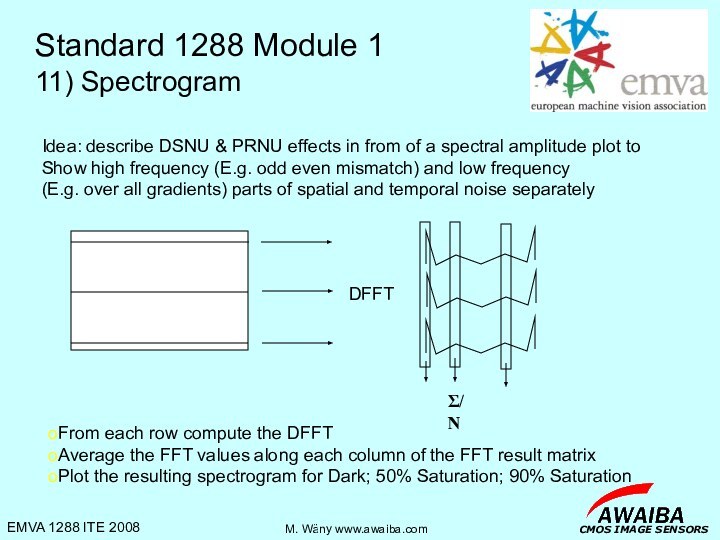
Idea: describe DSNU & PRNU effects in from of a spectral amplitude plot to
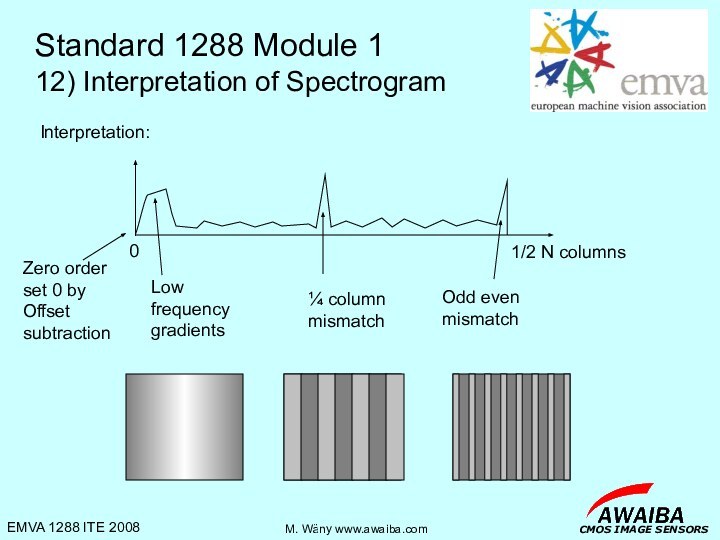
Show high frequency (E.g. odd even mismatch) and low frequency
(E.g. over all gradients) parts of spatial and temporal noise separately
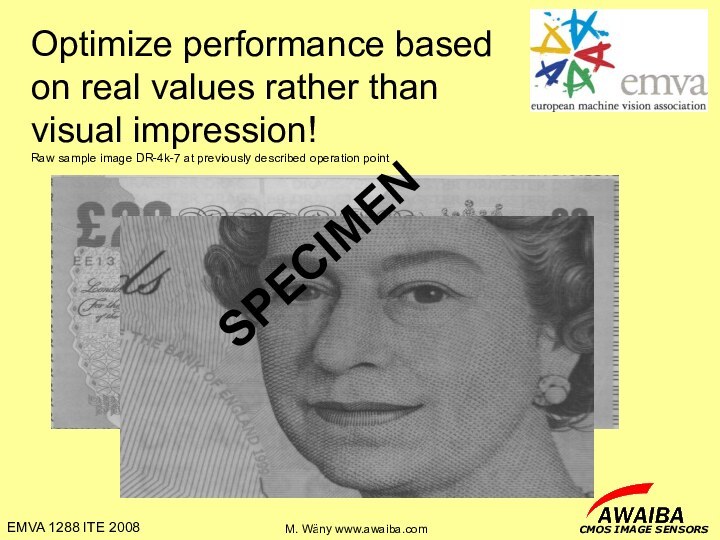
SPECIMEN